Are high-quality stocks worth the price? In the June 2017 update of their paper entitled “Quality Minus Junk”, Clifford Asness, Andrea Frazzini and Lasse Pedersen investigate whether high-quality stocks outperform low-quality stocks. They define high-quality stocks as those that are profitable, growing, safe and well-managed. Specifically, they compute a single quality score for each stock by averaging scores for three components calculated as follows:
- Profitability – average of rankings for (high) gross profits/assets, return on equity, return on assets, cash flow/assets, gross margin and fraction of earnings that is cash.
- Growth – average of rankings for (high) prior five-year growth rates for each of the six profitability measures.
- Safety – average of rankings for (low) market beta, idiosyncratic volatility, leverage, bankruptcy risk and volatility of return on equity.
They consider two modes of analysis: quality-sorted portfolios and quality-minus-junk (QMJ) long-short factor portfolios. Quality-sorted portfolios are by value-weighted tenths (deciles), reformed at the end of each calendar month. QMJ factor portfolio return is the average return on two value-weighted top 30% of quality portfolios (big stocks and small stocks separately) minus the average return on two value-weighted bottom 30% of quality portfolios (big stocks and small stocks separately), reformed monthly by sorting first on size and then on quality. For both modes, global portfolios are value-weighted composites of country portfolios in U.S. dollars. Using characteristics and returns for a broad sample of U.S. stocks since June 1957 and samples of stocks from 24 developed markets (including the U.S.) since June 1989, and contemporaneous U.S. Treasury bill yield as the risk-free rate, all through December 2016, they find that:
- Quality, especially the profitability component, is persistent (quality stocks tend to remain quality stocks).
- High-quality stocks tend to have high price-to-book value ratios, but not by much. A quality (value) strategy involves buying and selling stocks based on quality (price) irrespective of price (quality).
- The price of quality varies over time, with a high (low) current price of quality predicting a low (high) future return of quality stocks relative to junk stocks.
- A portfolio that is each month long the value-weighted decile of stocks with the highest prior-month quality and short the value-weighted decile of stocks with the lowest prior-month quality (see the charts below)…
- For the long-term U.S. sample, has:
- Average gross monthly return 0.40%.
- Gross monthly 4-factor (market, size, book-to-market, momentum) alpha 1.04%.
- Equity market beta -0.34 (potentially a good market hedge).
- Gross annualized Sharpe ratio 0.31.
- For the short-term global sample, has:
- Average gross monthly return 0.48%.
- Gross monthly 4-factor alpha 0.94%.
- Equity market beta -0.40 (potentially a good market hedge).
- Gross annualized Sharpe ratio 0.45.
- For the long-term U.S. sample, has:
- The long-short QMJ factor portfolio…
- For the long-term U.S. sample, has:
- Average gross monthly return 0.25%.
- Gross monthly 4-factor alpha 0.57%, relating negatively to all four factors.
- Gross annualized Sharpe ratio 0.41.
- For the short-term global sample, has:
- Average gross monthly return 0.36% (positive in 21 of 24 countries).
- Gross monthly 4-factor alpha 0.58% (positive in 23 of 24 countries), relatings negatively to market and size factors.
- Gross annualized Sharpe ratio 0.61.
- Generally performs much better during economic recessions than expansions and during low-volatility than high-volatility market environments.
- For the long-term U.S. sample, has:
- Quality complements value (high book-to-market ratio) by excluding stocks that look cheap but deserve to be cheap. For the long-term U.S. (short-term global) sample, the optimal quality/value weighting is 63%/37% (62%/38%), producing a gross annualized Sharpe ratio of about 0.7 (0.9).
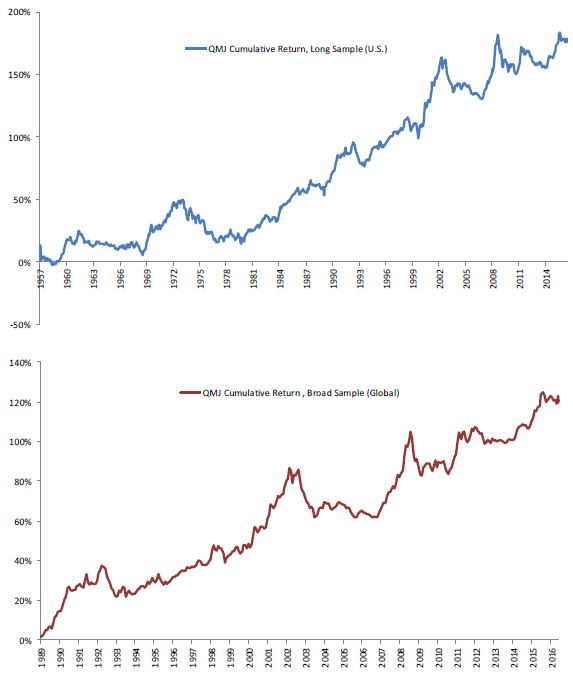
The following charts, taken from the paper, show cumulative gross excess returns in U.S. dollars of QMJ factor portfolios during June 1957 through December 2016 for the long-term U.S. sample (upper chart) and June 1989 through December 2016 for the short-term global developed markets sample (lower chart). Results indicate that the portfolio generally delivers positive excess returns over time, with moderate volatility.

In summary, evidence indicates that stocks of quality (profitable, growing and safe) firms consistently outperform their junk counterparts.
Cautions regarding findings include:
- Return calculations are gross, not net.
- Trading frictions involved in monthly portfolio reformation would reduce reported performance of quality stocks (with the persistence of quality mitigating).
- Long-short portfolio returns do not account for the costs/feasibility of shorting low-quality stocks. These issues would reduce reported returns and interfere with implementation.
- Costs of data collection and processing are likely material, and individuals may not be able to hold enough stocks for reliable exploitation of quality. Delegating these tasks to a fund manager would involve fees.
- While the breadth of inputs argues against data snooping in the specification of the quality ranking system, there still may be snooping bias in model construction.
Compare with Piotroski’s FSCORE (“Classic Paper: Piotroski’s Efficient Value Investing”) and Mohanram’s GSCORE (“Classic Paper: Mohanram’s Efficient Growth Investing”) as indicators of quality.