Should investors worry that investment strategies available in the marketplace may derive from optimization via intensive backtesting? In the September 2013 update of their paper entitled “Backtest Overfitting and Out-of-Sample Performance”, David Bailey, Jonathan Borwein, Marcos Lopez de Prado and Qiji Zhu examine the implications of overfitting investment strategies via multiple backtest trials. Using Sharpe ratio as the measure of strategy attractiveness, they compute the minimum backtest sample length an investor should require based on the number of strategy configurations tried. They also investigate situations for which more backtesting may produce worse out-of-sample performance. Based on interpretations of mathematical derivations, they conclude that:
- Researchers can generate high in-sample Sharpe ratios by backtesting a relatively small number of alternative strategy configurations. However, the more configurations tried, the greater the probability of overfitting (data snooping bias). And, the more complex the strategy (more parameters), the more configurations a researcher can generate.
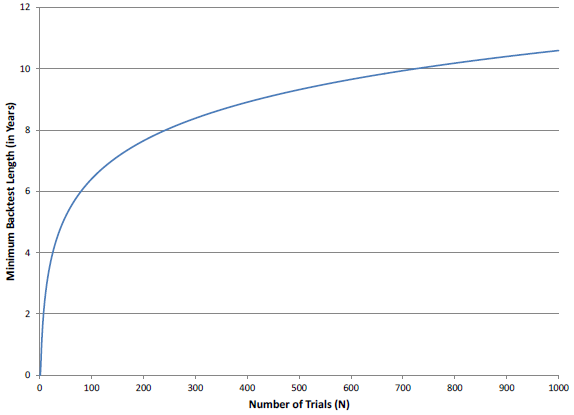
- A given sample has limited backtest “carrying capacity” (see the chart below). For example, testing more than 45 strategy configurations on a five-year sample is almost guaranteed to identify configurations with an in-sample annualized Sharpe ratio of one, but an expected out-of-sample annualized Sharpe ratio of zero.
- The more trials a researcher runs, the higher the in-sample Sharpe ratio an investor should demand.
- It is not possible to estimate the likelihood of overfitting for a strategy when the researcher does not report the number of alternatives tried in developing it.
- When a data series exhibits memory, there is a point at which further in-sample optimization via strategy backtesting actually worsens out-of-sample performance. Examples of memory in data are mean reversion and serial correlation (autocorrelation). A researcher can introduce memory into a data series via periodic renormalization.
The following chart, taken from the paper, depicts the relationship between number of strategy alternatives considered (N) and the minimum backtest length needed to prevent skill-less strategies (those with out-of-sample annualized Sharpe ratio zero) from generating an in-sample annualized Sharpe ratio of one.

In summary, investors should understand that generating high in-sample Sharpe ratios via iterative backtesting of strategy alternatives is easy to do, often difficult to detect and potentially harmful for out-of-sample performance.
Cautions regarding conclusions include:
- Tracking all strategy alternatives considered requires considerable discipline and is not clearly in the interest of strategy sellers.
- It is also difficult to detect derived overfitting, whereby research done by others (who do not document the strategy alternatives they considered) stimulates selection of a strategy for further testing. In other words, imprecise communications among researchers makes the number of models tested against a given data set essentially impossible to know.
- Assumptions (including use of Sharpe ratio) and derivations generally assume tame variable distributions. To the extent that these distributions are wild, statistical interpretations break down.
See also “Stock Return Model Snooping” and “Taming the Factor Zoo?”.