Does adding fundamental firm quality metrics to refine stock sorts based on traditional value ratios, book-to-market ratio (B/M) and earnings-to-price ratio (E/P), improve portfolio performance? In his 2013 paper entitled “The Quality Dimension of Value Investing”, Robert Novy-Marx tests combination strategies to determine which commonly used quality measures most enhance the performance of value ratios. He considers such quality metrics as Piotroski’s FSCORE, earnings accruals, gross profitability (GP) and return on invested capital (ROIC). His general test approach is to reform capitalization-weighted portfolios annually from stocks sorted at the end of each June according to value ratios and quality metrics for the previous calendar year. He uses the 1000 largest (2000 next largest) stocks by market capitalization to represent large (small) stocks. He considers both long-only (long the top 30%) and long-short (long the top 30% and short the bottom 30%) portfolios. He also considers the incremental benefit of incorporating stock price momentum based on return over the previous 11 months with a skip-month (11-1) into stock selection. He estimates trading frictions based on calculated turnover and effective bid-ask spreads. Using stock prices and associated firm fundamentals during July 1963 through December 2011, he finds that:
- Adding quality metrics, especially GP, helps traditional value investors distinguish bargains (truly undervalued) from traps (cheap for good reasons). Cheap, profitable firms tend to outperform those that are just cheap or just profitable.
- Quality tends to perform best when traditional value suffers large drawdowns, and vice versa, for both long-only and long-short portfolios.
- Among large (small) stocks, adding popular quality metrics to value strategies sometimes (often) improves portfolio performance, with Novy-Marx’s GP (Piotroski’s FSCORE and Novy-Marx’s GP) the clear best choice(s). Investors selecting stocks based on value and GP probably have little to gain by adding other quality metrics.
- GP is extremely persistent and works well for large stocks, thus offering relatively low turnover and allowing liquidity. The combination of value and GP is not highly susceptible to industry bias.
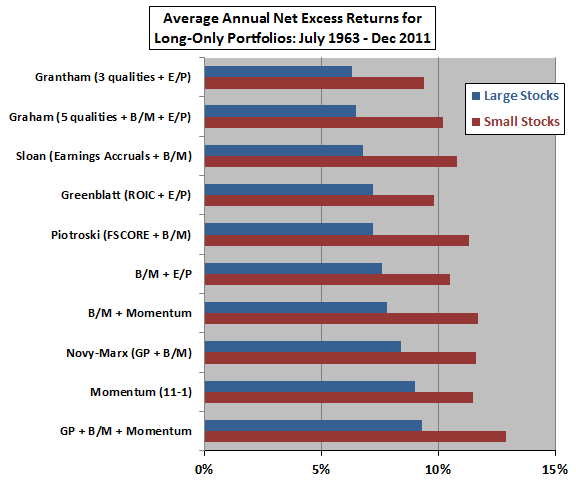
- Combining GP, value and momentum further improves performance (see the chart below).
The following chart, constructed from data in the paper, summarizes average annual net excess returns for long-only portfolios reformed annually as described above and applied separately to large stocks and small stocks during July 1963 through December 2011. Excess return means in excess of the contemporaneous U.S. Treasury bill yield. Long-only means the top 30% of stocks based on specified metrics. The ten strategies tested, with quality and value metrics weighted equally in sorting, are:
- Benjamin Graham’s five quality metrics (adequate size, strong current ratios, earnings stability, uninterrupted dividends and earnings per share growth) combined with both B/M and E/P.
- Jeremy Grantham’s three quality metrics (low leverage, high profitability and low earnings volatility) combined with E/P.
- Richard Sloan’s accruals-based measure of earnings quality combined with B/M.
- Joel Greenblatt’s “Magic Formula,” combining ROIC and E/P.
- Joseph Piotroski’s FSCORE aggregate quality metrics combined with B/M.
- Pure value, using B/M and E/P together.
- B/M combined with 11-1 momentum.
- Robert Novy-Marx’s GP quality metric combined with B/M.
- Pure 11-1 momentum.
- GP combined with B/M and 11-1 momentum.
Results indicate that:
- Adding some quality measures (Grantham, Graham and Greenblatt) does not clearly improve a pure long-only value strategy.
- Adding other quality measures (Sloan and Piotroski) improves a long-only value strategy only for small stocks.
- Adding GP as a quality measure (Novy-Marx) improves a long-only value strategy for both large and small stocks.
- Adding momentum improves a long-only value strategy for both large and small stocks.
- Combining GP, value and momentum is the optimal long-only strategy among tested combinations.

In summary, evidence indicates that the combination of high gross profitability, high book-to-market ratio and high price momentum materially improves pure value and pure momentum strategies when applied to U.S. stocks since the early 1960s.
Cautions regarding findings include:
- Testing multiple strategies on the same set of data introduces data snooping bias, such that the performance of the best strategy likely overstates out-of-sample expectations. Moreover, drawing upon prior research imports any data snooping bias in that research.
- The method used in the study to estimate trading frictions may be very optimistic from the perspective of individual investors.
- The study appears not to account for feasibility/cost of shorting for long-short portfolios, thereby overstating performance.
- Data collection and computations for some strategies may be out of reach for many investors, or costly if delegated to a manager (thereby reducing reported performance).
See also the closely related “Concentrating the Value Premium and Momentum with FSCORE”.