Do equity sectors have exploitably measurable relative value? In his February 2013 paper entitled “Equity Sector Rotation via Credit Relative Value” (the National Association of Active Investment Managers’ 2013 Wagner Award winner), Dave Klein outlines a long-only strategy that ranks Standard & Poor’s Select Sector SPDR exchange-traded fund (ETF) based on relative value. The strategy seeks to exploit a belief that sector valuations increase (decrease) differently as macro credit risk falls (rises). Specifically, the strategy each week: (1) regresses the weekly unadjusted price for each sector ETF versus the weekly option-adjusted spread for the Bank of America/Merrill Lynch High Yield B (HY/B) credit index over the last six months to determine a best-fit (fair value) line; (2) ranks sector ETFs from cheapest to most expensive (percentage below or above their respective fair value lines) based on the prior-day HY/B index value; and, (3) forms long-only, equally weighted portfolios of the cheapest one (Top 1) to eight (Top 8) ETFs. He asserts that a six-month regression is long enough to discover the relationship between ETF price and credit index, and short enough to ignore inflation and dividends and “forget” major market disruptions. He uses SPDR S&P 500 (SPY) and an equally weighted portfolio of all nine sector ETFs (All 9) as benchmarks. An alternative strategy substitutes 3-month U.S. Treasury bills (T-bills) for any of the cheapest ETFs in a portfolio that are still expensive (above their respective fair value lines). He also considers a relaxation of weekly portfolio reformation/rebalancing. Using weekly levels of the sector ETFs (both unadjusted and adjusted for dividends), the HY/B credit index and the T-bill yield during July 1999 through December 2012, he finds that:
- For the basic strategy over the entire sample period:
- Gross average total (dividend reinvested) returns decline systematically from the Top 1 through the Top 8 portfolios, with all higher than those for the All 9 and SPY benchmarks.
- Volatilities (maximum drawdowns) for the Top 1-8 portfolios are mostly higher (comparable to and sometimes more severe) than those for the benchmarks.
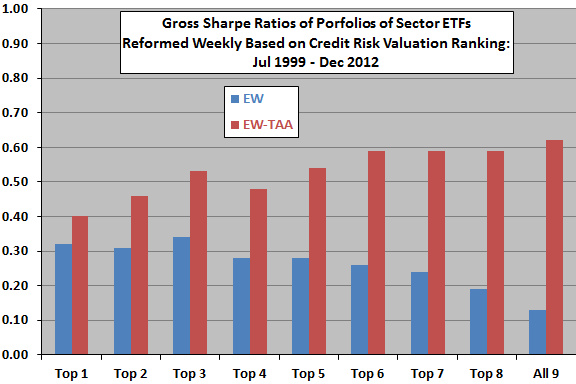
- Sharpe and Sortino ratios mostly decrease across the Top 1-8 portfolios, but high volatility and drawdown hurt the Top 1 and Top 2 portfolios (see the chart below). All ratios are higher than those for the benchmarks.
- Returns are essentially uncorrelated to other popular sector ranking strategies, suggesting diversification value.
- For the alternative strategy that avoids all overvalued sector ETFs by substituting T-bills:
- All Top 1-8 portfolios produce higher gross average total returns, lower volatilities, less severe maximum drawdowns and higher Sharpe and Sortino ratios than their basic strategy counterparts (see the chart below).
- However, while all Top 1-8 portfolios easily beat buying and holding SPY based on risk-adjusted metrics, they underperform an All 9 portfolio that similarly substitutes T-bills for overvalued ETFs (see again the chart below).
- A modification that relaxes rebalancing rules, applied to the Top 6 portfolio for the alternative strategy, reduces the average number of transactions per week from 6.8 to 2.4 but only minimally degrades risk-adjusted performance. Such a modification may be preferable on a net basis.
- Results are reasonably robust to varying the historical regression interval. In fact, seven and eight months work better than six months.
The following chart, constructed from data in the paper, summarizes gross Sharpe ratios for: (1) the Top 1-8 and All 9 equally weighted portfolios of sector ETFs reformed/rebalanced weekly (EW), with the Top 1-8 based on rankings from credit risk regressions; and, (2) the same portfolios with T-bills substituted for any “expensive” ETFs as determined by the same regressions (EW-TAA). EW considers only relative sector ETF valuations, while EW-TAA considers both relative and absolute valuations.
Results for the EW portfolios suggest some gross Sharpe ratio sensitivity to relative valuation based on macro credit risk. However, it appears that the absolute valuation criterion (expensive or cheap) used for EW-TAA is more important than relative valuation. In other words, the performance of EW-TAA appears to derive predominantly from exiting stocks when credit risk spikes, tending to drive all equity funds above their respective fair value regression lines.
Since portfolio turnover (due to valuation ranking changes and rebalancing to equal weight) likely varies across portfolios, results based on net Sharpe ratio may differ.

In summary, evidence indicates that investors may be able to exploit an intermediate-term relationship between equity prices and macro credit risk to time positions in equity sector portfolios (and perhaps equity portfolios generally).
Cautions regarding findings include:
- The sample is not long for the type of analyses performed, with only about 27 independent six-month regression intervals and (especially) only a few spikes in macro credit risk. Moreover, this sample period is “easy” for a timing strategy to beat, per “The 2000s: A Market Timer’s Decade?”, which finds that random timing generally beats the market over much of the sample period.
- Reported returns ignore trading frictions for both turnover of selected funds and weekly rebalancing to equal weight. As noted, since both turnover and rebalancing activity likely vary with the number of sectors selected, net findings may differ from gross findings. Results also ignore tax implications of trading.
- As noted, spikes in credit risk may drive results for the EW-TAA alternative strategy. There may be a strategy based only on the level of the macro credit risk metric (not using the ETF price-credit risk regressions) that works as well for timing equity exposure.