Is intrinsic (time series) momentum effective in managing risk across asset classes? In his April 2013 paper entitled “Absolute Momentum: a Simple Rule-Based Strategy and Universal Trend-Following Overlay”, Gary Antonacci examines an intrinsic (absolute or time-series) momentum strategy that each month holds a risky asset (U.S. Treasury bills) when the return on the risky asset over the preceding 12 months is greater (less) than the contemporaneous yield on U.S. Treasury bills. He applies the strategy separately to eight risky asset classes: two equity indexes (MSCI US and MSCI EAFE); three bond/credit classes constructed from Barclay’s Capital Long U.S. Treasury, Intermediate U.S. Treasury, U.S. Credit, U.S. High Yield Corporate, U.S. Government & Credit and U.S. Aggregate Bond indexes; the FTSE NAREIT U.S. Real Estate Index; the S&P GSCI; and, spot gold based on the London PM fix. He also evaluates intrinsic momentum strategy performance for a 60%-40% MSCI US-Long U.S. Treasury portfolio and a portfolio consisting of five equally weighted assets, both rebalanced monthly. He assumes a friction of 0.2% for switching between a risky asset and U.S. Treasury bills (T-bill). Using monthly total returns for the eight asset classes as available and 90-day T-bills yields during January 1973 through December 2012, he finds that:
- For the entire sample period and decade subperiods, a 12-month intrinsic momentum measurement interval (from among intervals of 2 to 18 months) generates the best Sharpe ratios across asset classes.
- Applying the 12-month intrinsic momentum strategy to each asset class separately over the entire sample period:
- Boosts annual Sharpe ratio, lowers maximum drawdown and raises the percentage of profitable months relative to a buy-and-hold benchmark for all eight asset classes.
- Generates a higher terminal value for equal initial investments in the strategy and buy-and-hold for five of eight asset classes.
- Slightly lowers the average pairwise correlation of the eight asset classes from 0.22 to 0.21 (in other words, does not impair diversification).
- Generates an average annual number of switches with T-bills ranging from 0.33 for the REIT index to 1.08 for the high-yield corporate bond index.
- Applying the 12-month intrinsic momentum strategy to the two asset classes within a 60%-40% stocks-bonds portfolio, rebalanced frictionlessly each month, boosts annual Sharpe ratio from 0.47 to 0.72 and cuts maximum drawdown from -29.3% to -13.4%.
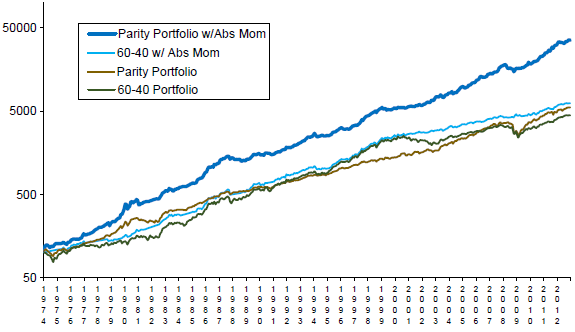
- Applying the 12-month intrinsic momentum strategy to the five asset classes within an equally weighted portfolio of MSCI US, Long U.S. Treasury, U.S. Credit, FTSE NAREIT U.S. Real Estate and spot gold, rebalanced frictionlessly each month, boosts annual Sharpe ratio from 0.62 to 1.06 and cuts maximum drawdown from -30.4% to -9.6% (see the chart below). It also improves these performance metrics for each of four approximately equal subperiods.
The following chart, taken from the paper, compares the cumulative values of $100 initial investments in each of the following four portfolios during 1974 through 2012:
- 60%-40% MSCI US-Long U.S. Treasury, rebalanced frictionlessly each month (60-40 Portfolio).
- The 12-month intrinsic momentum strategy applied separately to the two asset classes within the 60-40 Portfolio (60-40 w/Abs Mom).
- Equally weighted portfolio of MSCI US, Long U.S. Treasury, U.S. Credit, FTSE NAREIT U.S. Real Estate and spot gold, rebalanced frictionlessly each month (Parity Portfolio).
- The 12-month intrinsic momentum strategy applied separately to each of the five asset classes within the Parity Portfolio (Parity Portfolio w/Abs Mom).
Results indicate that applying the 12-month intrinsic momentum strategy to mitigate asset class risk improves long-term portfolio performance.

In summary, evidence suggests that a strategy based on intrinsic momentum effectively manages risk both for individual asset classes and for portfolios comprised of multiple asset classes.
Cautions regarding findings include:
- The sample period (and especially subperiods) is not long in terms of number of independent 12-month intrinsic momentum measurement intervals.
- While mitigated by subperiod tests, there may be material residual data snooping bias in selecting the in-sample optimal 12-month measurement interval, thereby overestimating future performance (see “10-Month SMA Reputation a Data Mining Artifact?”).
- There may be data snooping bias in the selection of the five asset classes used in the multi-asset class portfolio, thereby overestimating future performance.
- The study uses indexes rather than tradable assets. Incorporating the management/administrative costs and trading frictions involved in maintaining a liquid fund, which likely vary by asset class, would reduce reported returns.
- The assumed 0.2% switching friction is likely very optimistic for all assets for part of the sample period and perhaps all of the sample period for some asset classes (for U.S. equities, see “Trading Frictions Over the Long Run”).
- Analyses assume that monthly rebalancing of multi-asset class portfolios is frictionless. Incorporating reasonable trading frictions would reduce returns for these portfolios.
- The assumption of coincident intrinsic momentum signal generation and execution is problematic when switching into or out of an index comprised of many component assets.
See “Optimal Intrinsic Momentum and SMA Intervals Across Asset Classes” for application of intrinsic momentum to exchange-traded fund (ETF) proxies over recent years.