Does use of alphas from linear factor models to identify anomalies in U.S. stock returns mislead investors? In the February 2013 draft of their paper entitled “Using Maximum Drawdowns to Capture Tail Risk”, Wesley Gray and Jack Vogel investigate maximum drawdown (largest peak-to-trough loss over a time series of compounded returns) as a simple measure of tail risk missed by linear factor models. Specifically, they quantify maximum drawdowns for 11 widely cited U.S. stock return anomalies identified via one-factor (market), three-factor (plus size and book-to-market ratio) and four-factor (plus momentum) linear models. These anomalies are: financial distress; O-score (probability of bankruptcy); net stock issuance; composite stock issuance; total accruals; net operating assets; momentum; gross profitability; asset growth; return on assets; and, investment-to-assets ratio. They calculate alphas for each anomaly by using the specified linear model risk factors to adjust gross monthly returns from a portfolio that is long (short) the value-weighted or equal-weighted tenth of stocks that are “good” (“bad”) according to that anomaly, reforming the portfolio annually or monthly depending on anomaly input frequency. Using monthly returns and firm fundamentals for a broad sample of U.S. stocks, and contemporaneous stock return model factor returns, during July 1963 through December 2012, they find that:
- For value-weighted portfolios, momentum, financial distress, return on assets and gross profitability generate the highest gross three-factor monthly alphas (2.23%, 1.52%, 1.07% and 0.87%, respectively). For equal-weighted portfolios, net operating assets, asset growth, momentum and investment-to-assets ratio generate the highest gross three-factor monthly alphas (1.20%, 1.17%, 1.14% and 1.14%, respectively).
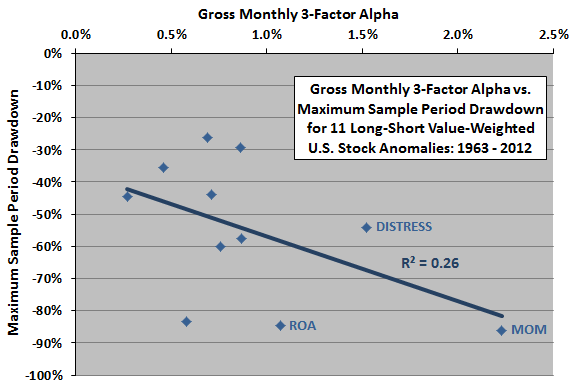
- However, all anomalies suffer large drawdowns during the sample period (see the chart below).
- Momentum, return on assets and O-score suffer the deepest maximum drawdowns (-86.0%, -84.7% and -83.5%, respectively).
- Six of the 11 anomalies have maximum drawdowns deeper than -50%, losses that would trigger margin calls and liquidations by brokers.
- Net stock issuance and composite stock issuance suffer the shallowest maximum drawdowns (-29.2% and -26.3%, respectively). However, S&P 500 Index returns during these drawdowns are 56.4% and 49.5%, respectively, arguably making it difficult for investors to stick with the anomalies.
- All anomalies experience strong positive returns over the three, six and 12 months after their respective maximum drawdowns, suggesting that anomaly drawdowns do, in fact, force liquidations that would inhibit exploitation of their most profitable times.
The following chart, constructed from data in the paper, summarizes the relationship between gross monthly 3-factor alphas and maximum sample period (1963-2012) drawdowns for 11 widely cited U.S. stock return anomalies, with alphas derived from monthly differences in returns between extreme value-weighted deciles of anomaly stock sorts. The three highest alphas are for momentum (MOM), financial distress (DISTRESS) and return on assets (ROA).
Results suggest that there may be a negative relationship between alpha and maximum drawdown (tail risk), with magnitude of drawdown explaining about a quarter of the alpha (R-squared statistic 0.26). In other words, the higher the alpha, the deeper the maximum drawdown. However, the sample of anomalies is very small.
Eight of the 11 maximum drawdown intervals occur within the last 15 years of the sample period. The fact that most such intervals are recent suggests an underlying common cause for anomaly breakdowns.

In summary, evidence suggests that non-linear drawdown events materially interfere with exploitation of known U.S. stock return anomalies.
More generally, per the authors: “Tail risk matters to investors and it should matter in empirical research.”
Cautions regarding findings include:
- Academic studies of the kind cited generally use gross, not net, returns. Incorporation of realistic trading frictions associated with periodic portfolio reformation (especially momentum, for which portfolio reformation is monthly) would reduce anomaly returns. Trading frictions vary considerably over time. Moreover, differences in trading frictions across portfolios sorted on anomaly metrics may affect study conclusions.
- These studies also generally ignore costs of shorting and the likely infeasibility of complete shorting (lack of shares to borrow). Incorporation of realistic shorting costs/constraints would reduce anomaly returns. Moreover, differences in shorting costs/constraints across portfolios sorted on anomaly metrics may affect study conclusions.