“Pervasiveness and Robustness of SMA Effectiveness for Stocks” summarizes research finding that long-term simple moving averages (SMA) pervasively outperform a buy-and-hold approach for U.S. stocks and stock portfolios during 1960-2011 and for seven developed stock markets during 1975-2010. Does this research, which focuses on a 24-month SMA, discover some essential cyclical nature of equity markets? To verify, we test the effectiveness of a 24-month SMA timing strategy versus a buy-and-hold approach for three U.S. stock market series: (1) SPDR S&P 500 (SPY); (2) the underlying S&P 500 Index (augmented with dividend yields estimated from Robert Shiller’s data); and, (3) the Dow Jones Industrial Average (DJIA). The limiting input for the third test is availability of a U.S. Treasury bills (T-bill) yield. The 24-month SMA strategy shifts to stocks (T-bills) when the monthly close crosses above (below) the 24-month SMA. We also test both a 23-month intrinsic momentum strategy, which is in stocks (T-bills) when the lagged 23-month return is positive (negative), and a comparable 10-month SMA strategy. For all timing strategies, we assume an investor can slightly anticipate signals and execute trades at the same close. Using monthly returns for SPY since January 1993 (dividend-adjusted), the S&P 500 Index with dividend yields from Shiller since January 1950 and DJIA since January 1932, along with contemporaneous monthly 3-month T-bill yields, all through January 2016, we find that:
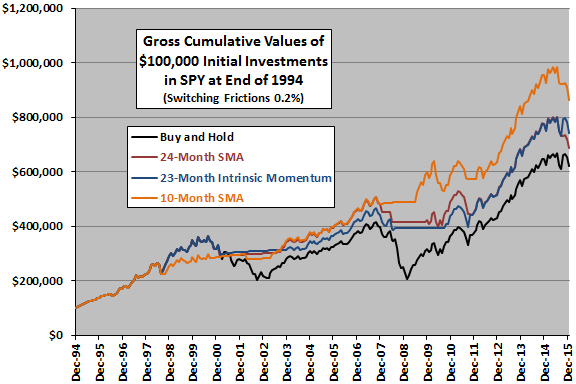
The following chart tracks net cumulative values of $100,000 initial investments at the end of 1994 in a buy-and-hold strategy, the 24-month SMA strategy, the 23-month intrinsic momentum strategy and the 10-month SMA strategy as applied to SPY. The timing strategies assume 0.2% one-way frictions for switching between SPY and T-bills.
All the timing strategies beat buy-and-hold over the 21-year sample period. The 10-month SMA strategy performs best. The 24-month SMA and 23-month intrinsic momentum strategies perform similarly.
For additional perspective, we look at an array of performance statistics.

The following table summarizes numbers of switches, average monthly returns, standard deviations of monthly returns, monthly Sharpe ratios, compound annual growth rates (CAGR) and maximum drawdowns (MaxDD) for all four strategies as applied to SPY over the available sample period.
The 10-month SMA strategy wins on all metrics except number of switches (and attendant tax implications). The 23-month intrinsic momentum strategy outperforms the 24-month SMA timing strategy for all metrics.
A 21-year sample period is not long for strategies based on two-year signal measurement intervals. Do the timing strategies work as well for the underlying index over a longer sample period?

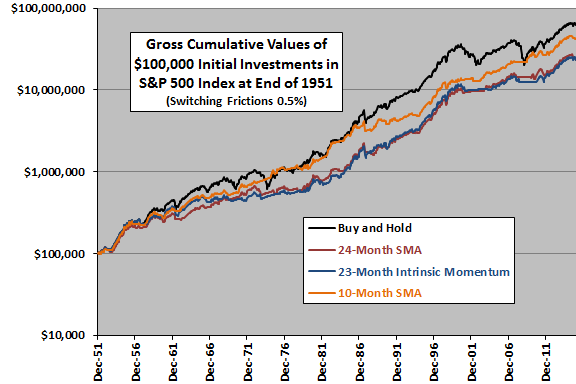
The next chart tracks (on a logarithmic scale) net cumulative values of $100,000 initial investments at the end of 1951 in a buy-and-hold strategy, the 24-month SMA strategy, the 23-month intrinsic momentum strategy and the 10-month SMA strategy as applied to the S&P 500 Index with estimated dividends. The timing strategies assume 0.5% one-way frictions for switching between index stocks and T-bills.
None of the timing strategies clearly beats buy-and-hold over the 64-year sample period. The 10-month SMA strategy again outperforms the other two timing strategies, which again perform similarly to each other.
For additional perspective, we again look at an array of performance statistics.

The next table summarizes numbers of switches, average monthly returns, standard deviations of monthly returns, monthly Sharpe ratios, CAGRs and MaxDDs for all four strategies as applied to the S&P 500 Index over the available sample period.
The 10-month SMA strategy offers some advantages over buy-and-hold (lower volatility, higher Sharpe ratio and smaller MaxDD), but a lower CAGR. The other timing strategies offer only lower volatilities and small MaxDDs.
How well do the timing strategies work for another index and an even longer sample period extending back into the Great Depression?

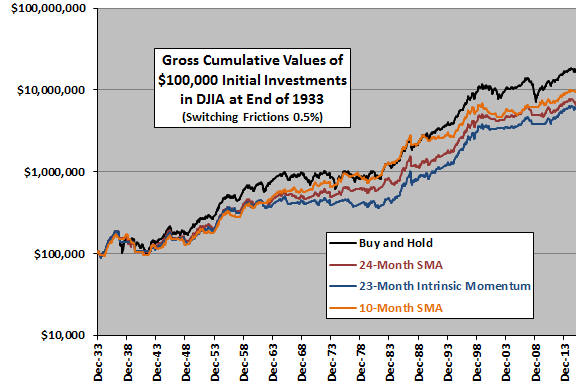
The final chart tracks (on a logarithmic scale) net cumulative values of $100,000 initial investments at the end of 1933 in a buy-and-hold strategy, the 24-month SMA strategy, the 23-month intrinsic momentum strategy and the 10-month SMA strategy as applied to DJIA. The timing strategies assume 0.5% one-way frictions for switching between DJIA stocks and T-bills.
None of the timing strategies clearly beats buy-and-hold over the 82-year sample period. The 10-month SMA strategy mostly outperforms the other two timing strategies. The 24-month SMA strategy mostly outperforms the 23-month intrinsic momentum strategy.
For additional perspective, we again look at an array of performance statistics.

The final table summarizes numbers of switches, average monthly returns, standard deviations of monthly returns, monthly Sharpe ratios, CAGRs and MaxDDs for all four strategies as applied to DJIA over the available sample period.
For this index and sample period, the timing strategies do not exhibit much MaxDD suppression. The large drawdowns coincide during World War II. The 10-month SMA strategy offers low volatility and a Sharpe ratio comparable to that of buy-and-hold.

In summary, evidence from simple tests suggests that the effectiveness of the 24-month SMA timing strategy is not pervasive over time series longer than those used in the referenced research (and is generally inferior to a conventional 10-month SMA strategy).
In other words, results in the referenced research may be specific to the sample periods used, with pervasiveness within those periods deriving from highly correlated returns rather than an inherent long-run equity market cycle.
Cautions regarding findings include:
- As noted, since the 24-month SMA and 23-month intrinsic momentum strategies generate few signals, it is difficult to distinguish meaning (reliable time series shapes for bear markets) from luck in signal timing.
- The simplifying assumption of constant trading frictions for the above tests may be material to findings. Trading frictions are likely higher early in the sample periods and lower later (see “Trading Frictions over the Long Run”).
- The success of the 10-month SMA timing strategy may involve snooping of early data (bias from partly in-sample testing) that make it popular.
- The above analyses ignore any tax implications of trading.
See also “Is There a Best SMA Calculation Interval for Long-term Crossing Signals?”.