“Identifying VXX/SVXY Tendencies” finds that S&P 500 implied volatility index (VIX) futures roll return, as measured by the percentage difference in settlement price between the nearest and next nearest VIX futures, may be a useful predictor of iPath S&P 500 VIX Short-Term Futures ETN (VXX) and ProShares Short VIX Short-Term Futures ETF (SVXY) returns. VXX and SVXY target 1X daily performance for VXX and -0.5X for SVXY relative to the S&P 500 VIX Short-Term Futures Index. Is there a way to exploit this predictive power? To investigate, we compare performances of:
- SVXY B&H – buying and holding SVXY.
- SVXY-Cash – holding SVXY (cash) when prior-day roll return is negative (zero or positive).
- SVXY-VXX – holding SVXY (VXX) when prior-day roll return is negative (zero or positive).
We focus on compound annual growth rate (CAGR) and maximum drawdown (MaxDD) as key performance statistics. Using daily split-adjusted closing prices for SVXY and VXX and daily settlement prices for VIX futures from SVXY inception (October 2011) through December 2019, we find that:
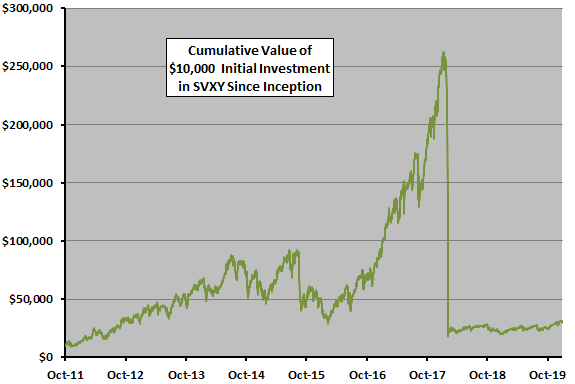
The following chart tracks cumulative value of a $10,000 initial investment in SVXY B&H over the full sample period. CAGR is an attractive 14.7%, but MaxDD, which occurs during the infamous short volatility crash of February 2018, is a daunting -93%.
Can we improve this performance by avoiding days when prior-day VIX roll return is zero or positive?
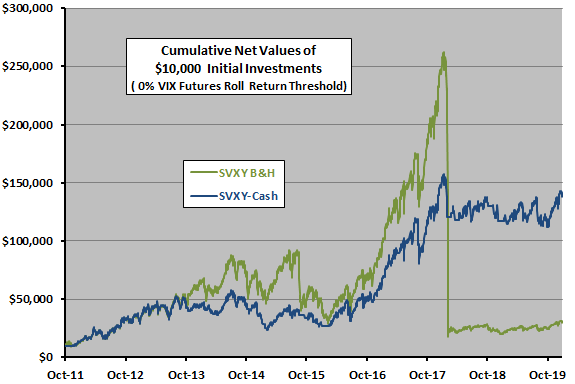
The next chart compares SVXY-Cash to SVXY B&H over the available sample period. For SVXY-Cash, we assume:
- We can effectively estimate sign of the VIX futures roll return just before SVXY close.
- Trading frictions are 0.2% per SVXY-Cash switch.
- Return on cash is zero.
- There are no tax implications of trading.
SVXY-Cash underperforms SVXY B&H through much of the sample period. But, SVXY-Cash avoids about half of the February 2018 short volatility crash, thereby ultimately winning by a wide margin. For SVXY-Cash (SVXY B&H) over the full sample period:
- Average net daily return is 0.17% (0.17%).
- Standard deviation of daily returns is 3.00% (4.12%).
- Net CAGR is 38.0% (14.7%).
- MaxDD is -58% (-93%).
SVXY-Cash generates 123 switches, so results are somewhat sensitive to the assumed level of trading frictions.
How sensitive are results to the VIX futures roll return signal threshold, and to a delay of one day in signal execution?
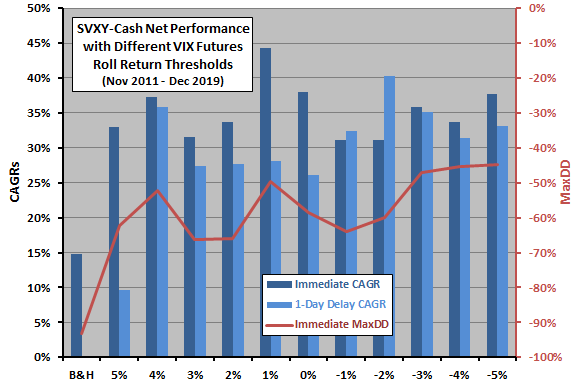
The next chart summarizes sensitivity of net CAGR for SVXY-Cash to variation in the VIX futures roll return threshold from -5% to +5% (increments of 1%) for both immediate signal execution as above and an alternative with one-day delay between signal and trade. SVXY-Cash holds SVXY (cash) when roll return is at or below (above) the threshold. The chart also shows (right axis) the sensitivity of MaxDD for immediate signals to threshold variation.
SVXY-Cash is not decisively sensitive within the range of thresholds with or without execution delay, except for CAGR with threshold +5% and a one-day delay.
What about SVXY-VXX?
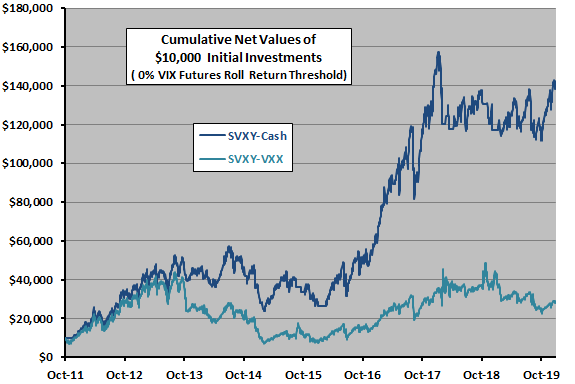
For the SVXY-VXX alternative, we again start with a VIX futures roll return threshold of 0%, but we double the assumed level of trading frictions to 0.4% per switch. For SVXY-VXX (SVXY-Cash) over the available sample period:
- Average net daily return is 0.13% (0.17%).
- Standard deviation of daily returns is 3.84% (3.00%).
- Net CAGR is 13.7% (38.0%).
- MaxDD is -83% (-58%).
SVXY-VXX underperforms SVXY-Cash throughout the sample period. Since the signals are the same as above, there are 123 switches between SVXY and VXX.
How sensitive are SVXY-VXX results to the VIX futures roll return threshold and to a one-day delay in signal execution?
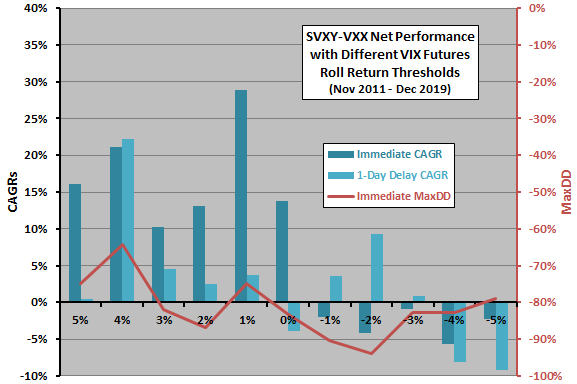
The final chart summarizes sensitivity of net CAGR for SVXY-VXX to variation in the VIX futures roll return threshold from -5% to +5% for both immediate and one-day delayed signal executions. Results suggest that SVXY-VXX works better for high thresholds than low ones for immediate signal execution. Overall, this alternative is not reliably attractive.
In summary, available evidence suggests that investors may be able to exploit the predictive power of VIX futures roll return by switching between SVXY and cash according to the sign of the roll return, but performance is still subject to large drawdowns.
Cautions regarding findings include:
- The available sample is small in terms of number of VIX regimes, thereby limiting confidence in findings.
- The offeror changed construction of SVXY from -1X index exposure to -0.5X exposure in early 2018 in response to the February 2018 crash of short volatility. This change is somewhat confounding to the above analyses, likely weakening any relationships with SVXY return.
- Some other measure of VIX futures roll return (such as slope across maturities) may work better.
- The growing trade in VIX-related ETNs may be undermining timing strategies by affecting the behavior of VIX futures.
- SVXY and VXX are financial instruments constructed from derivatives for a measurement of U.S. stock market expected volatility (not a real asset), dependent on the financial health of the offeror.
See also “Volatility Trading Strategies”.