A subscriber asked: “Have you looked at combining sector and asset class momentum models? This strategy would add alternative asset classes plus cash to the nine sectors.” A combined strategy encompasses nine sector exchange-traded funds (ETF) defined by the Select Sector Standard & Poor’s Depository Receipts (SPDR) per “Simple Sector ETF Momentum Strategy” plus the eight ETFs and cash that cut across asset classes per “Simple Asset Class ETF Momentum Strategy” (SACEMS), as follows:
Materials Select Sector SPDR (XLB)
Energy Select Sector SPDR (XLE)
Financial Select Sector SPDR (XLF)
Industrial Select Sector SPDR (XLI)
Technology Select Sector SPDR (XLK)
Consumer Staples Select Sector SPDR (XLP)
Utilities Select Sector SPDR (XLU)
Health Care Select Sector SPDR (XLV)
Consumer Discretionary Select SPDR (XLY)
PowerShares DB Commodity Index Tracking (DBC)
iShares MSCI Emerging Markets Index (EEM)
iShares MSCI EAFE Index (EFA)
SPDR Gold Shares (GLD)
iShares Russell 1000 Index (IWB)
iShares Russell 2000 Index (IWM)
SPDR Dow Jones REIT (RWR)
iShares Barclays 20+ Year Treasury Bond (TLT)
3-month Treasury bills (Cash)
We consider a simple (6-1) strategy that allocates all funds each month to the one sector or asset class ETF/cash with the highest total return over the past six months (effectively pitting the sector winner against the asset class winner). Using monthly dividend-adjusted closing prices for the ETFs over the period July 2002 (limited by data availability for enough asset class ETFs) through April 2012 (118 months), we find that:
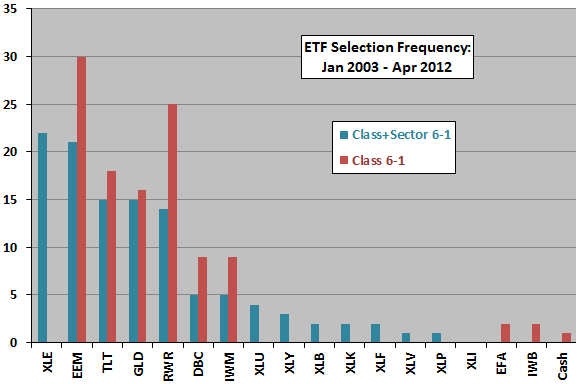
The following chart compares the distribution of winning ETFs based on past six-month momentum over the available sample period for the combined sector and asset class strategy (Class+Sector 6-1) and the asset class strategy alone (Class 6-1). Availability of sector ETFs substantially displaces equity, real estate and commodities ETFs.
How does applying the Class+Sector 6-1 strategy translate into cumulative returns?

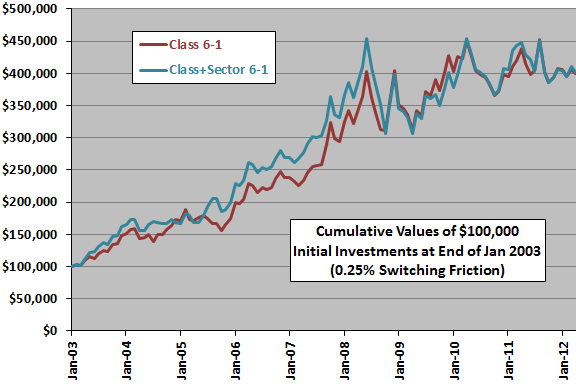
The next chart compares the cumulative values of $100,000 initial investments in the Class 6-1 and the Class+Sector 6-1 momentum strategies over the available sample period. Calculations derive from the following assumptions:
- Reallocate at the close on the last trading day of each month (assume that total six-month past returns for the ETFs can be calculated just before the close).
- Trading (switching) friction is 0.25% of the balance whenever there is an ETF switch.
- Ignore any tax implications of trading.
At the assumed level of switching friction, the two strategies perform similarly, with a slight edge to the combined strategy. The number of switches for Class+Sector 6-1 is 53, compared to 45 for Class 6-1, so a lower level of trading friction would favor the combined strategy.
The average net monthly return for Class+Sector 6-1 (Class 6-1) is 1.44% (1.43%), with standard deviation 6.04% (5.92%), confirming performance similarly.

In summary, evidence from simple tests indicates that a combined asset class and U.S. equity sector momentum ETF strategy performs similarly to the asset class momentum ETF strategy.
The sector ETFs effectively displace large capitalization stock ETFs.
Cautions regarding findings include:
- Sample size is modest (about 20 independent six-month momentum ranking intervals).
- The selected ETF ranking interval derives from prior academic studies that most often use six-month and 12-month ranking intervals, with one-month holding intervals. This prior research may impound (and therefore transmit) data snooping bias, which is especially pernicious for small samples. Ranking intervals other than six months and holding periods other than one month may produce different results. For the above tests, using longer ranking and holding intervals would effectively reduce the already-small sample size. Optimizing the ranking and holding intervals would elevate data snooping bias.
- Potential wildness in ETF monthly return distributions limits confidence in results.