Are there reliable predictors supporting strategies for timing exchange-traded notes (ETN) constructed from near-term S&P 500 Volatility Index (VIX) futures, such as iPath S&P 500 VIX Short-Term Futures ETN (VXX) and ProShares Short VIX Short-Term Futures ETF (SVXY), available since 1/30/09 and 10/4/11, respectively. The managers of these securities buy and sell VIX futures daily to maintain a constant maturity of one month, continually rolling partial positions from nearest to next nearest contracts. VXX and SVXY target 1X and -0.5X daily performance relative to the S&P 500 VIX Short-Term Futures Index, respectively. We consider five potential predictors for these ETNs:
- Level of VIX, in case a high (low) level indicates a future decrease (increase) in VIX that might affect VXX and SVXY.
- Change in VIX (VIX “return”), in case there is some predictable reversion or momentum for VIX that might affect VXX and SVXY.
- Implied volatility of VIX (VVIX), in case uncertainty in the expected level of VIX might affect VXX and SVXY.
- Term structure of VIX futures (roll return) underlying VXX and SVXY, as measured by the percentage difference in settlement price between the nearest and next nearest VIX futures, indicating a price headwind or tailwind for a fund manager continually rolling from one to the other. VIX roll return is usually negative (contango), but occasionally positive (backwardation).
- Volatility Risk Premium (VRP), estimated as the difference between VIX and the annualized standard deviation of daily S&P 500 Index returns over the past 21 trading days (multiplying by the square root of 250 to annualize), in case this difference between expectations and recent experience indicates the direction of future change in VIX. VRP is usually positive, but occasionally negative.
We measure predictive power of each in two ways: (1) correlations between daily VXX and SVXY returns over the next 21 trading days to daily predictor values; and, (2) average next-day SVXY returns by ranked tenth (decile) of daily predictor values. Using daily levels of VIX and VVIX, settlement prices for VIX futures contracts, level of the S&P 500 Index and split-adjusted prices for VXX and SVXY from inceptions of the ETNs through December 2019, we find that:
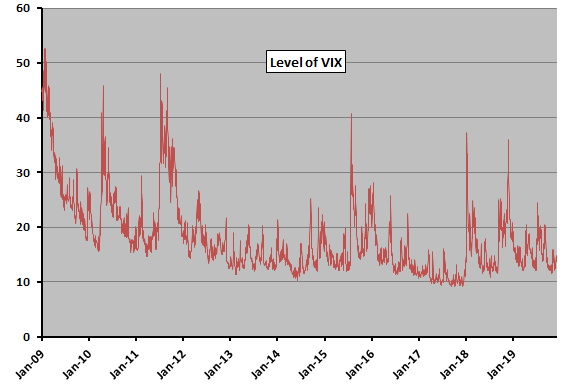
The following chart tracks daily level of VIX since the end of January 2009. We use this sample to investigate its power to predict daily VXX and SVXY returns.
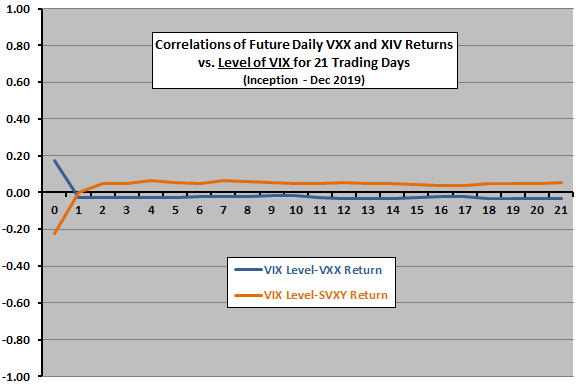
The next chart relates future daily VXX and SVXY returns for each of the next 21 trading days to daily level of VIX over available sample periods. Day 0 is the VIX level measurement date. Results offer some support for belief that VIX level usefully predicts VXX or SVXY daily returns over at least the next month.
In case there is an important non-linear effect, we look at average next-day SVXY returns by decile of daily VIX levels.
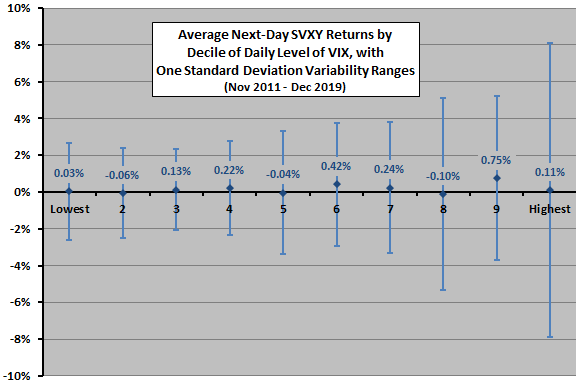
The next chart summarizes average next-day SVXY returns by decile of daily level of VIX over the available sample period, with one standard deviation variability ranges. There is no progression of average returns across deciles, nor much temptation to develop a strategy that excludes returns for high or low levels of VIX.
What about change in VIX level?
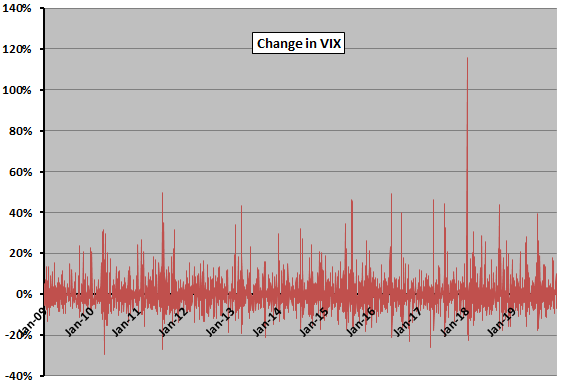
The next chart tracks daily change in VIX since the end of January 2009. We use this very noisy sample to investigate its power to predict daily VXX and SVXY returns.
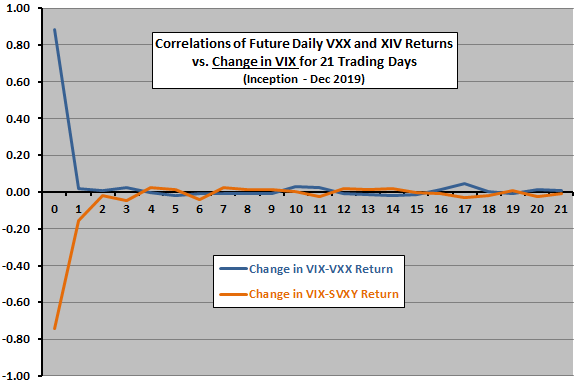
The next chart relates future daily VXX and SVXY returns for each of the next 21 trading days to daily change in VIX over available sample periods. Day 0 is the measurement date for change in VIX. Results do not support belief that daily VIX change has a consistent/useful relationship with VXX or SVXY daily returns over the next month. Findings in “Exploit Short-term VIX Reversion with VXX?” generally agree.
In case there is an important non-linear effect, we look at average next-day SVXY returns by decile of daily changes in VIX.
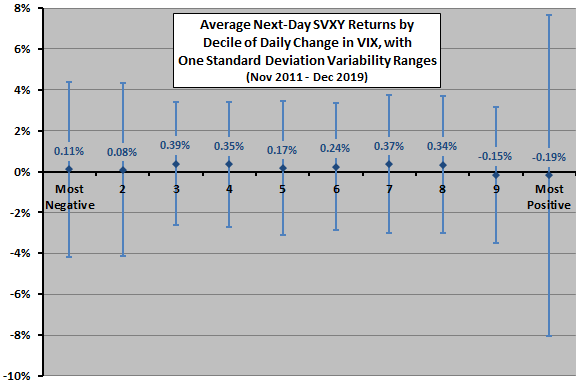
The next chart summarizes average next-day SVXY returns by decile of daily change in VIX over the available sample period, with one standard deviation variability ranges. There is no progression of average returns across deciles. There is some indication that excluding returns after extreme changes in VIX may be helpful.
What about level of VVIX?
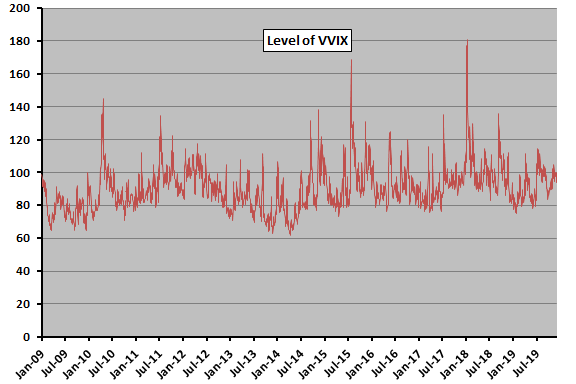
The next chart tracks daily level of VVIX since the end of January 2009. We use this sample to investigate its power to predict daily VXX and SVXY returns.
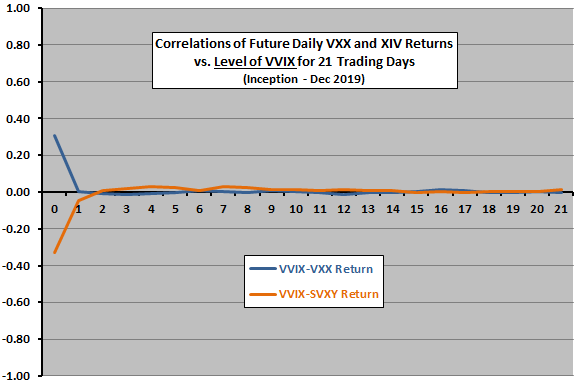
The next chart relates future daily VXX and SVXY returns for each of the next 21 trading days to daily level of VVIX over available sample periods. Day 0 is the measurement date for VVIX. Results do not support belief that daily VVIX has a consistent/useful relationship with VXX or SVXY daily returns over the next month.
In case there is an important non-linear effect, we look at average next-day SVXY returns by decile of daily levels of VVIX.
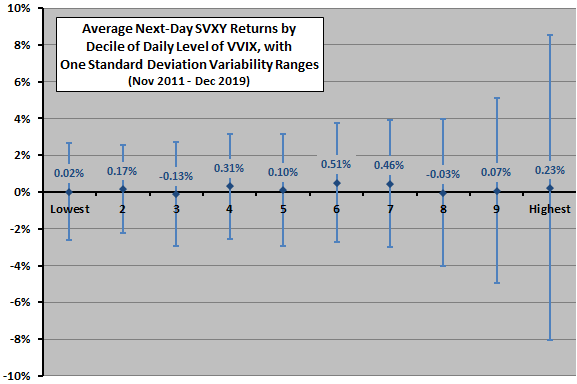
The next chart summarizes average next-day SVXY returns by decile of daily level of VVIX over the available sample period, with one standard deviation variability ranges. There is no progression of average returns across deciles, nor much temptation to develop a strategy that excludes returns for high or low levels of VIX.
What about VIX futures roll return?
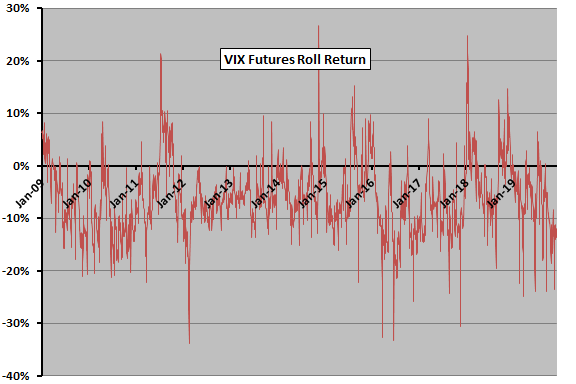
The next chart tracks daily VIX futures roll return since the end of January 2009. It is mostly negative. We use this sample to investigate its power to predict daily VXX and SVXY returns.
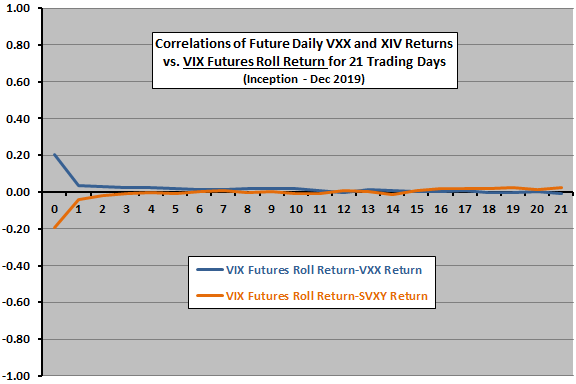
The next chart relates future daily VXX and SVXY returns for each of the next 21 trading days to daily VIX futures roll return over available sample periods. Day 0 is the VIX futures roll return measurement date. There is small indication of a positive (negative) relationship between roll return and SVXY (VXX) return lasting one to a few days.
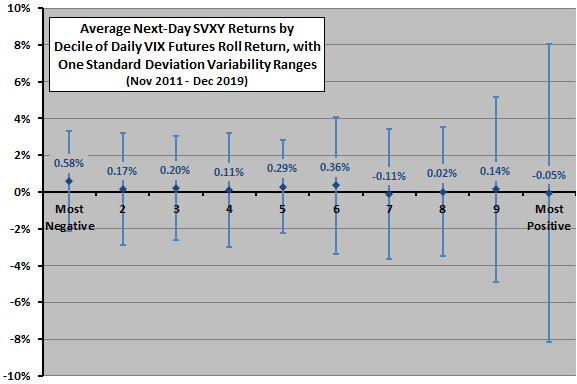
In case there is an important non-linear effect, we look at average next-day SVXY returns by decile of daily VIX futures roll return.
The next chart summarizes average next-day SVXY returns by decile of daily VIX futures roll return over the available sample period, with one standard deviation variability ranges. There is perhaps some progression of average returns downward across deciles. There is some temptation to develop a strategy that excludes returns for higher (most positive) VIX futures roll returns, which have relatively low average returns and high volatilities.
What about VRP?
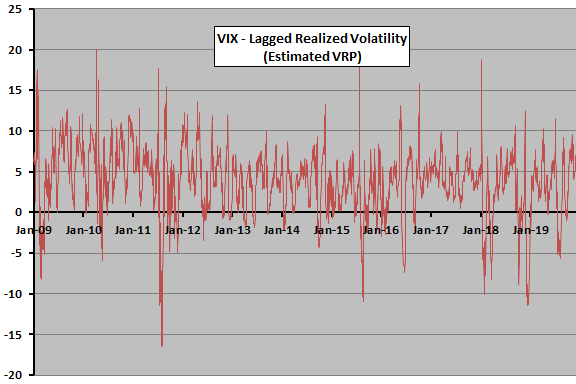
The next chart tracks daily VRP since the end of January 2009. It is mostly positive. We use this sample to investigate its power to predict daily VXX and SVXY returns.
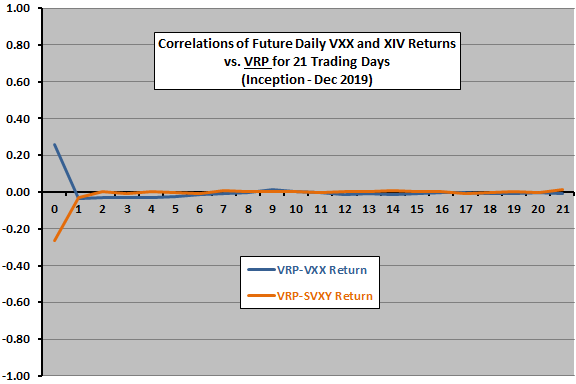
The next chart relates future daily VXX and SVXY returns for each of the next 21 trading days to daily VRP over available sample periods. There is perhaps slight support for belief in a short-term negative relationship between VRP and SVXY return.
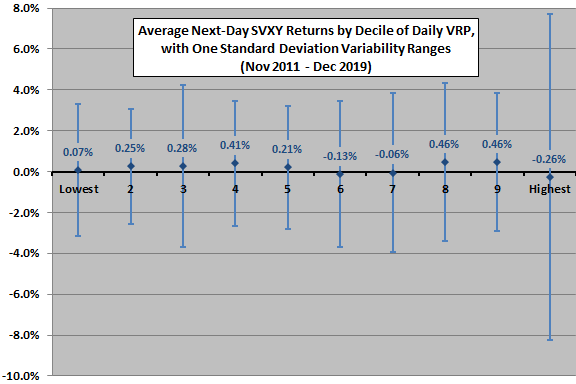
In case there is an important non-linear effect, we look at average next-day SVXY returns by decile of daily VRP.
The final chart summarizes average next-day SVXY returns by decile of daily VRP over the available sample period, with one standard deviation variability ranges. There is no progression of average returns across deciles and not much temptation to develop a strategy that excludes returns for extreme values of VRP.
In summary, evidence from simple tests on available data suggests that VXX and SVXY trading strategies that exclude the highest (most positive) VIX futures roll returns is most promising.
Cautions regarding findings include:
- Sample periods for VXX and (more so) SVXY are short, especially with respect to number of VIX regimes. The available samples may not be representative of long-term behaviors.
- All above tests are in-sample. Available sample periods are very short for out-of-sample testing.
- The offeror changed construction of SVXY from -1X VIX exposure to -0.5X exposure in early 2018 in response to the February 2018 crash of short volatility. This change is somewhat confounding to the above analyses, likely weakening any relationships with SVXY return.
- Translating findings into trading strategies involves frictions that work against profitability.
- Testing many predictors on the same data introduces snooping bias, such that results for the best-performing overstates expectations.
- Some term structure metric other than nearest to next nearest VIX futures price change (such as overall term structure slope) may work differently.
- Some other metric for VRP may work better (such as one based on a higher-frequency measurement).
- Trading in the easily accessible VXX and SVXY and similar products may have grown so intense that they stimulate demand for VIX futures, thereby changing market behavior.
- These ETNs are financial instruments constructed from derivatives of a measurement of U.S. stock market expected volatility (not a real asset), dependent on the financial health of the offerors.
See also “Diversification with VIX Futures and Related ETNs” and “Short-term VIX Futures Performance”.