In general, when the U.S. stock market goes down, the S&P 500 volatility index (VIX) goes up. VIX is not investable, but VIX futures are available. Are short-term VIX futures a good way to hedge equity market declines and guard against market blow-ups? To investigate we focus on returns from holding the contract nearest to maturity, rolling to the next nearest on maturity dates. For simplicity, we assume that rolling is frictionless (favorable to futures) and that available capital always matches a round number of futures contracts (no residual cash). Using daily levels of VIX and daily settlement values of all VIX futures series from late March 2004 through late March 2012 (eight years), we find that:
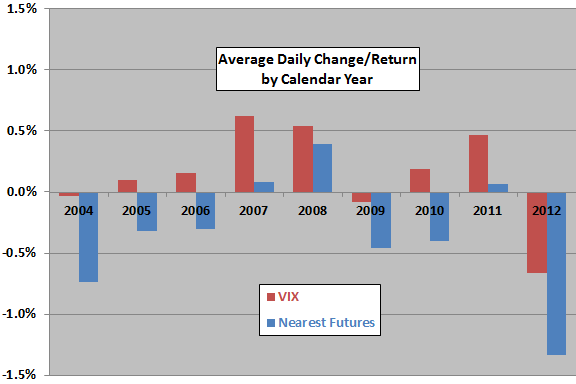
The following chart compares average daily changes in VIX and average daily gross returns from continuously holding the VIX futures contract nearest to maturity by calendar year, with 2004 and 2012 partial years. Over the entire sample period the average daily change in VIX (daily VIX futures gross return) is 0.23% (-0.23%), with standard deviation 7.03% (4.38%). By calendar year, VIX futures consistently underperform VIX and are mostly negative.
It appears that the premium demanded by sellers of futures contracts for protection against equity market volatility is steep.
How do these annual statistics translate into long-term cumulative value?
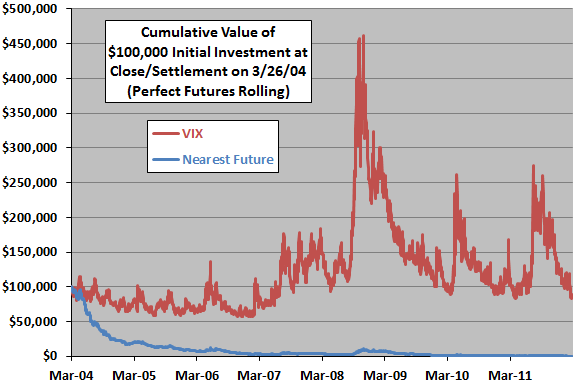
The next chart compares trajectories of $100,000 initial investments in VIX (assuming one could invest directly in VIX) and the VIX futures contract nearest to maturity over the entire sample period. Results suggest that a direct investment in VIX may be attractive for hedging and crash protection, but the premium charged by sellers of VIX futures contracts more than offsets the attractiveness. The terminal value of the $100,000 initial investment in VIX futures is $158 (a loss of 99.8%).
Might VIX futures have redeeming behaviors further from, or closer to, maturity?
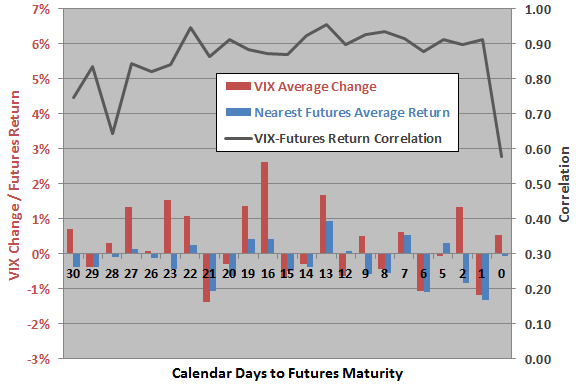
The next chart compares average daily changes in VIX and average daily gross returns for the VIX futures contract nearest to maturity, along with the correlations of the two series, by number of calendar days to maturity. Sample sizes are roughly 90 for days to maturity 0-27 and roughly 30 for days to maturity 28-30. Results are:
- As above, VIX futures generally underperform VIX.
- The mostly high correlation between changes in VIX and VIX futures returns tends to break down on the maturity date.
- There may be some tendency for both series to weaken as the maturity date approaches, but any such tendency is weak and inconsistent.
It appears that successful trading of VIX futures on the long side requires accurate market timing. Does the term structure of VIX futures (measured by the slope in values from spot VIX through the futures contracts up to 12 months out) provide timing information?
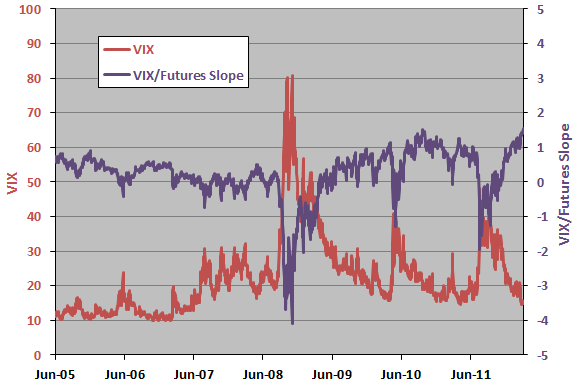
The next chart shows the values of VIX and the slope of VIX futures prices with maturity. Samples start in late June 2005 because prior VIX futures data are often too scant for slope calculations. The two series appear to be approximate mirror images. In other words, when VIX is low (high), the prices of VIX futures contracts tend to increase more steeply (increase less steeply or decrease) with time to maturity.
To investigate whether the slope of futures prices with maturity is useful, we try a regression and a ranking.
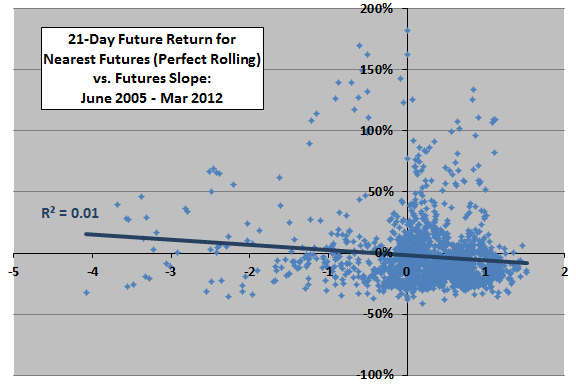
The following scatter plot relates the 21-trading day future return from holding the VIX futures contract nearest to maturity (with frictionless rolling and fully allocated funds) to the slope of VIX futures prices with maturity. Results suggest that an upward slope (contango) may be slightly less favorable than a downward slope (backwardation). The Pearson correlation for the two series is -0.12 and the R-squared statistic 0.01, indicating that the futures term structure explains 1% of variation in future returns.
Winnowing the data by selecting every 21st observation yields about the same results.
Is there an important tail effect?
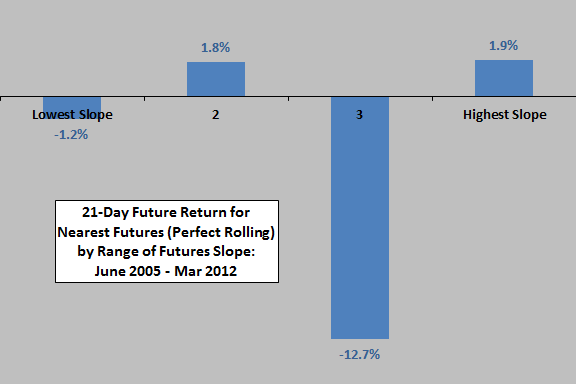
The final chart summarizes average 21-trading day future return from holding the VIX futures contract nearest to maturity (with frictionless rolling and fully allocated funds) by quartile of slope of VIX futures prices with maturity. The average slope for the lowest (highest) quartile is -0.76 (0.99). Results do not support belief in a systematic relationship between the two series.
In summary, evidence from simple tests indicates that short-term VIX futures are a losing game on the long side.
It appears that selling volatility protection may be the better side (subject to occasional disasters). Findings likely transfer to financial vehicles based on VIX futures such as the iPath S&P 500 VIX Short Term Futures (VXX) exchange-traded notes (ETN).
Cautions regarding findings include:
- As noted, the above analyses ignore the costs of rolling as futures contracts mature and the inevitable mismatch between round contract numbers and funding. Accounting for these complexities would affect returns from futures contracts.
- Using daily closing prices, rather than daily settlement values, for VIX futures contracts may marginally affect results.
See also “Simple Tests of VXX as Diversifier” and “Exploit Short-term VIX Reversion with VXX?”.