A subscriber suggested applying a simple momentum trading strategy to a set of leveraged equity style (size, value-growth) exchanged-traded funds (ETF), including leveraged long and leveraged short counterparts to exploit both positive and negative markets. It seems plausible that leverage may make funds react quickly and strongly to business cycle shifts that affect style performance. However, the costs of maintaining leverage are countervailing. We test a set of 12 ProShares 2X and -2x leveraged sector ETFs, all of which have trading data back at least as far as April 2007:
ProShares Ultra Russell1000 Value (UVG)
ProShares Ultra Russell1000 Growth (UKF)
ProShares Ultra Russell MidCap Value (UVU)
ProShares Ultra Russell MidCap Growth (UKW)
ProShares Ultra Russell2000 Value (UVT)
ProShares Ultra Russell2000 Growth (UKK)ProShares UltraShort Russell1000 Value (SJF)
ProShares UltraShort Russell1000 Growth (SFK)
ProShares UltraShort Russell MidCap Val (SJL)
ProShares UltraShort Russell MCap Growth (SDK)
ProShares UltraShort Russell2000 Value (SJH)
ProShares UltraShort Russell2000 Growth (SKK)
As in “Simple Sector ETF Momentum Strategy Performance” and “Doing Momentum with Style (ETFs)”, we consider a basic momentum strategy that allocates all funds at the end of each month to the ETF with the highest total return over the past six months (6-1). Using monthly adjusted closing prices for the 12 leveraged style ETFs and S&P Depository Receipts (SPY) over the period April 2007 through November 2011 (only 56 months), we find that:
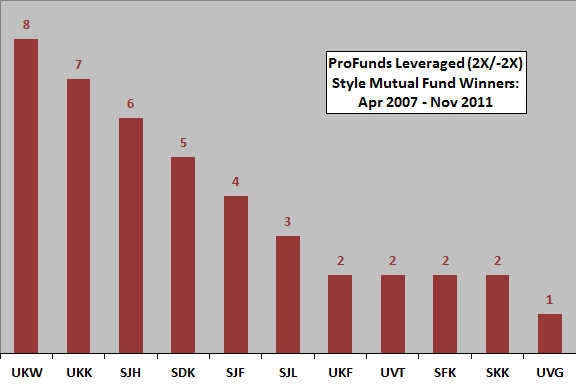
The following chart shows the distribution of leveraged ETF winners based on past six-month returns over the entire sample period. The mix of 2X and -2X funds obviously depends on broad market bull-bear conditions during the period.
How does applying the 6-1 momentum strategy to these top-ranked ETFs translate into cumulative returns?

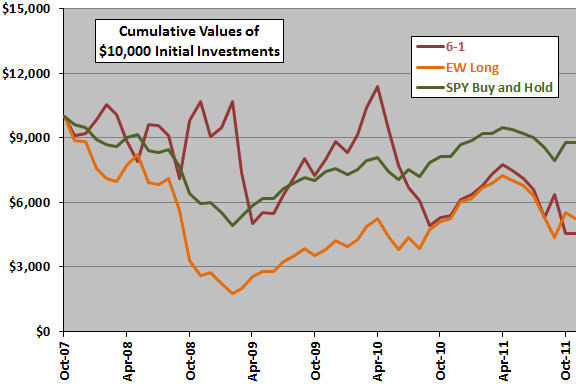
The next chart compares the cumulative values over the sample period of $10,000 initial investments in the leveraged style ETF 6-1 momentum strategy, an equally weighted and monthly rebalanced portfolio of the six 2X style ETFs (EW Long) and buying and holding SPY. Calculations derive from the following assumptions:
- Reallocate at the close on the last trading day of each month (assume we can estimate six-month past total returns for the ETFs just before the concurrent close).
- Ignore trading frictions.
- Ignore any tax implications of trading.
On a frictionless trading basis, the 6-1 momentum strategy sometimes outperforms and sometimes underperforms buying and holding SPY. Both the 6-1 momentum strategy and the EW Long benchmark have lower terminal values than SPY, with much more volatility.
How do average monthly returns, as alternative measures of strategy performance, compare?

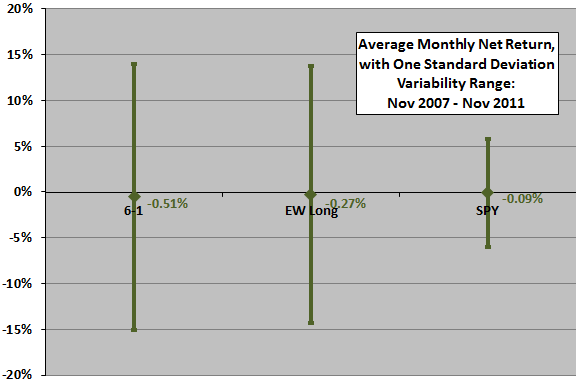
The final chart depicts average monthly returns and standard deviations of monthly returns for the leveraged style ETF 6-1 momentum strategy, EW Long and buying and holding SPY over the entire sample period. Even on a frictionless trading basis, SPY buy-and-hold has the highest (though still negative) average monthly return and by far the lowest monthly volatility.
The average monthly return for the 6-1 strategy when operating on 2X (-2X) fund signals is +0.90% (-2.39%), indicating that the short side does not work.

In summary, evidence from simple tests over a very short sample period does not support belief that a basic leveraged style ETF (2X and -2X) momentum strategy is attractive.
Cautions regarding findings include:
- As noted, sample size is very small (fewer than ten independent six-month momentum ranking intervals).
- Including trading frictions would lower the performance of the 6-1 momentum strategy and the EW Long benchmark.
- Ranking intervals other than six months and holding periods other than one month may produce different results. Optimizing the ranking and holding intervals would impound data snooping bias,
- Lengthy holding periods for leveraged funds are problematic (see “Multi-year Performance of Leveraged ETFs” as linked above, plus “Multi-year Performance of Non-equity Leveraged ETFs”, “Unintended Characteristics of Leveraged and Inverse ETFs” and “Performance of Leveraged ETFs over Extended Holding Periods”).
- Potential wildness in leveraged ETF monthly return distributions further limits confidence in results.