Do simple moving averages (SMA) commonly used to identify stock market bull and bear regimes work similarly for the spot gold market? To investigate, we consider two market regime indicators: the 200-day SMA and a combination of the 50-day and 200-day SMAs. Because trading days for gold and stocks are sometimes different, we also check a 10-month SMA based on monthly closes. Using daily and monthly spot gold prices and S&P 500 Index levels during January 1973 through April 2016, we find that:
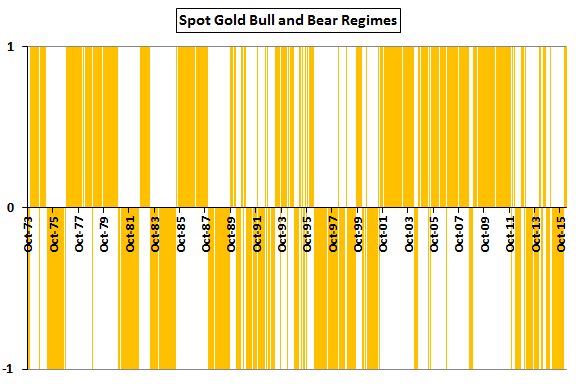
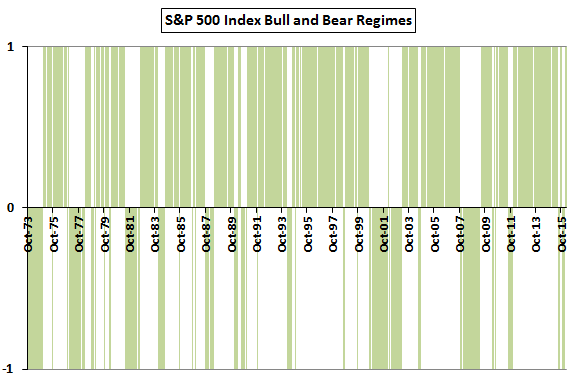
The first two charts summarize bull and bear market regimes for spot gold (upper chart) and the S&P 500 Index (lower chart) over the sample period, with initial SMA calculations in October 1973. Bull (bear) regimes are shaded between 0 and 1 (-1 and 0), representing times when asset price is above (below) its 10-month SMA. The two asset classes are in the same regime a little less than half the time. Specifically:
- Both are in bull regimes 36% of the time.
- Stocks are in a bull regime and gold is in a bear regime 34% of the time.
- Stocks are in a bear regime and gold is in a bull regime 19% of the time.
- Both are in bear regimes 11% of the time.
The Pearson correlation of market regime indications between the two asset classes is -0.10. The correlation of monthly returns between them is 0.01.
To dig deeper, we calculate average daily returns and standard deviations of returns for gold bull and bear regimes based on a 200-day SMA.
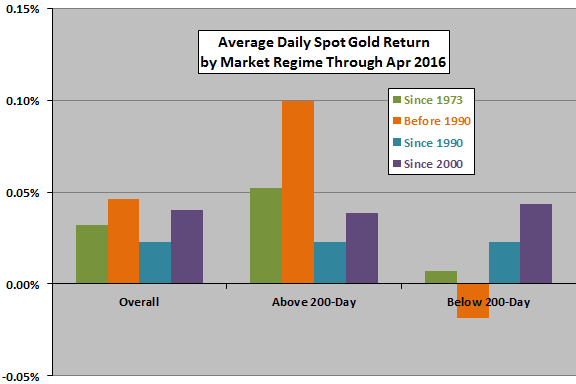
The next chart summarizes average daily returns for spot gold market regimes (price above or below the 200-day SMA) over the entire sample period and three subperiods. Results show that price relative to the 200-day SMA identifies spot gold market regimes overall, driven entirely by early data. Since 1990 and since 2000, the 200-day SMA does not identify spot gold regimes based on average returns.
Results based on a 10-month SMA are similar.
Is the 200-day SMA effective in identifying spot gold return volatility regimes?
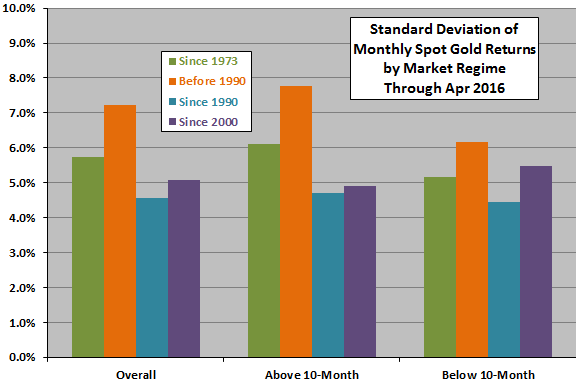
The next chart summarizes standard deviations of daily returns for spot gold when price is above or below the 200-day SMA over the entire sample period and the same three subperiods. Results show that price relative to the 200-day SMA does not consistently identify spot gold return volatility regimes. If anything, the bear market regime tends to be less volatile.
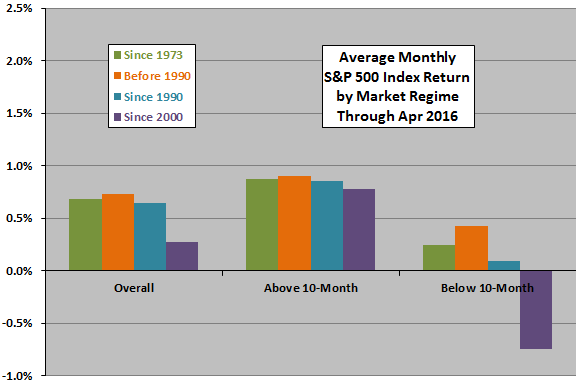
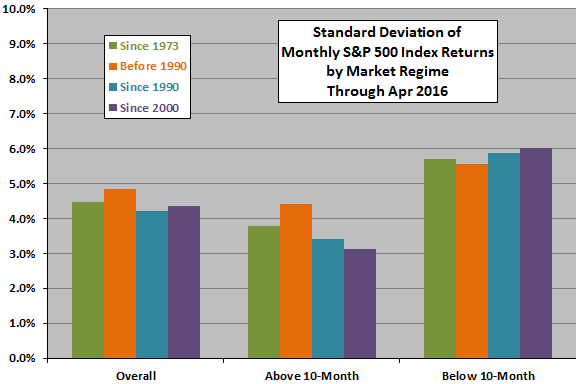
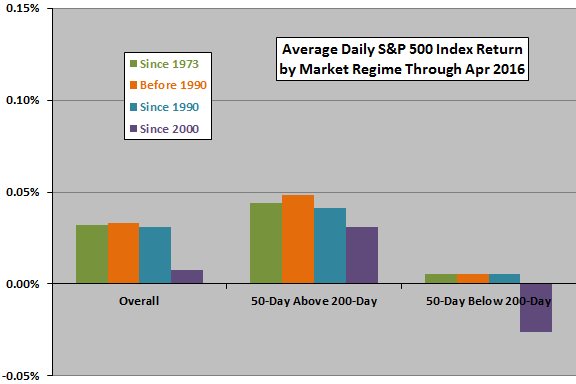
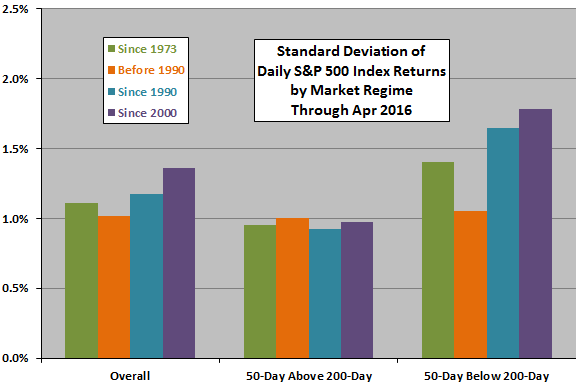
For comparison, the following two charts summarize average daily returns (upper chart) and standard deviations of daily returns (lower chart) for S&P 500 Index regimes above and below the 200-day SMA over the same sample period and subperiods. Results show that the 200-day SMA more consistently segregates high and low average daily returns and low and high daily return volatilities for the U.S. stock market.
What about a combination of 50-day and 200-day SMAs?
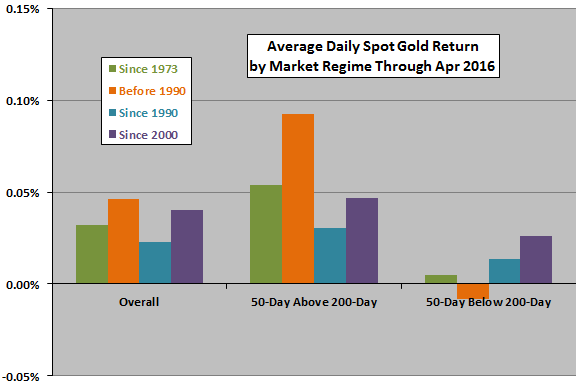
The next chart summarizes average daily returns for spot gold when the 50-day SMA is above or below the 200-day SMA over the entire sample period and three subperiods. Results show that the 50-day SMA relative to the 200-day SMA identifies high-low spot gold return regimes well early in the sample period, but less effectively for recent subperiods.
Is the combination of 50-day and 200-day SMAs effective in defining spot gold return volatility regimes?
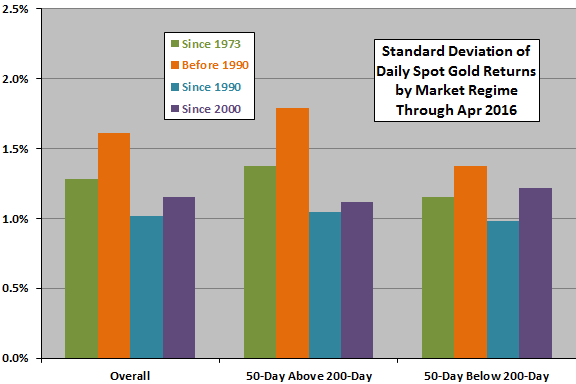
The next chart summarizes standard deviations of daily returns for spot gold when the 50-day SMA is above or below the 200-day SMA over the entire sample period and the same three subperiods. Results show that the 50-day SMA relative to the 200-day SMA generally does not identify spot gold return volatility regimes.
For comparison, the following two charts summarize average daily returns and standard deviations of daily returns for S&P 500 Index regimes when the 50-day SMA is above and below the 200-day SMA over the same sample period and subperiods. Results show that the 50-day SMA relative to the 200-day SMA is consistently segregates high and low average daily returns and usually segregates low and high daily return volatilities for the U.S. stock market, most emphatically in the most recent subperiod.
In summary, evidence from simple tests on available data show that 200-day and 50-day/200-day SMA rules used to identify U.S. stock market return and volatility regimes do not work, or do not work well, for the spot gold market.
Cautions regarding findings include:
- Sample and especially subsamples durations are short in terms of number of independent 200-day SMA calculation intervals.
- Relevant to exploitation, calculations assume investors can accurately estimate whether a price series will close above or below SMAs just before the close, thereby enabling a trade at that close.
- Calculations ignore trading frictions (and management fees for tradable spot gold and stock index proxies) and tax implications of trading.
See “SMA Signal Effectiveness Across ETFs” for similar tests of these indicators across U.S. stock market sectors and styles.