Does the size effect vary in a predictable way? In the May 2011 version of his paper entitled “Explaining the Dynamics of the Size Premium”, Valeriy Zakamulin investigates relationships between eight market/economic variables and the size effect in U.S. stocks to identify the best model of size effect variation. The eight variables are: (1) stock market return; (2) stock market dividend yield; (3) equity value premium; (4) stock return momentum; (5) default spread (Moody’s BAA-AAA corporate bond yield spread); (6) Treasury bill yield; (7) U.S. Treasuries term premium (30-year bond yield minus one-month bill yield); and, (8) inflation rate. He then tests the exploitability of the best model via a strategy that switches between small-capitalization and large-capitalization stocks out of sample based on inception-to-date historical data. Using annual data for the eight potentially predictive variables and annual and monthly data for the magnitude of the size effect among NYSE, AMEX and NASDAQ stocks as available over the period 1927 through 2009 (83 years), he finds that:
- The size premium tends to emerge as the term premium increases and after negative market returns (during “bad times”). Moreover, the size effect tends to persist (exhibits momentum).
- A strategy that each year allocates all funds to the smallest tenth of market capitalizations on a value-weighted basis when the inception-to-date combination of lagged market returns and lagged size effect predicts a positive size effect, and otherwise allocates all funds to the largest tenth of market capitalizations, generates an economically and statistically significant gross three-factor (adjusting for market, size and book-to-market) monthly alpha during 1957-2009.
- The magnitude of this alpha is roughly half that based on perfect foresight of the size effect over the test period.
- The Sharpe ratio for the strategy is substantially greater than that for consistently holding either the smallest or largest tenth of market capitalizations over the test period.
- Results generally hold both for the entire 1957-2009 out-of-sample test period and for a 1972-2009 subperiod.
- When adjusted for a momentum factor, the strategy exhibits a gross alpha that is economically but not statistically significant.
- Trading frictions for the strategy are arguably immaterial because switching is infrequent (due to size effect persistence), though there would be annual trading frictions from stocks entering and leaving the smallest and largest tenths of market capitalizations.
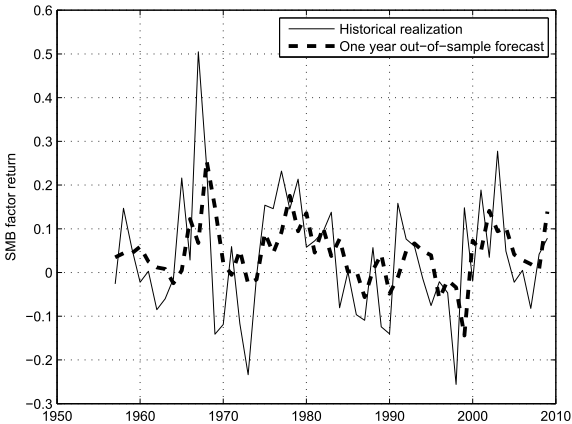
The following chart, taken from the paper, portrays rolling one-year forecasts of the size effect return during a 1957-2009 out-of-sample test period based on lagged size effect magnitude and lagged stock market returns. The initial 1957 prediction derives from data for 1927-1956, with one year of historical data added for each iterative prediction. The correlation between actual and predicted size effect returns over the entire test period is 0.347 (R-squared statistic 0.12, indicating that the prediction explains 12% of the variation in actual returns). The R-squared statistic for the 1972-2009 subperiod is 0.17.

In summary, evidence indicates that investors may be able to time the size effect in the U.S. stock market based on its positive relationship with the lagged magnitude of the size effect itself and its negative relationship with lagged stock market returns.
The fact that the size effect emerges during bad times suggests a connection to lagged stock market volatility.
Cautions regarding findings include:
- The sample is not long when defined in terms of numbers of “bad times” and “good times.”
- Investigating the explanatory powers of many variables within a single data set (at both individual researcher and community levels) introduces data snooping bias, thereby overstating the power of the best model.
- Even though switching frequency is low at for the strategy described above, trading frictions during parts of the out-of-sample test (especially for small-capitalization stocks) would be very large compared to modern values, especially for investors with limited funds (implying many small positions). In other words, it is not obvious that trading frictions are immaterial.
- Statistical significance tests apparently assume tame variable distributions. To the extent that actual distributions are wild, these tests lose power.
See “Doing Momentum with Style (ETFs)” and “Measuring the Size Effect with Capitalization-based ETFs” for explorations of related concepts accessible to many individuals via exchange-traded funds.