Are many mutual fund managers worldwide so fixated on benchmarks that they substantially emulate index funds, while charging shareholders “active” fees? In the April 2011 version of their paper entitled “The Mutual Fund Industry Worldwide: Explicit and Closet Indexing, Fees, and Performance”, Martijn Cremers, Miguel Ferreira, Pedro Matos and Laura Starks address the prevalence and consequences of index versus active investing in the mutual fund industry around the world. They focus on “closet index” funds that are nominally active but do not deviate much from benchmark compositions, applying an “Active Share” measurement to quantify the degree of deviation. Using data for large samples of alive and dead open-end equity mutual and exchange-traded funds across 30 countries during 2002 through 2007, they find that:
- As of June 2010, there were more than 68,000 (7,600) mutual funds worldwide (in the U.S.) with over $21 trillion ($10.5 trillion) in assets under management. Fund fees vary considerably across countries, with U.S. funds having the lowest.
- As of 2007, about 16% of equity mutual fund assets under management worldwide were in explicit index funds, 20% for the U.S. versus 7% for other countries. In some countries, there were no explicit index funds.
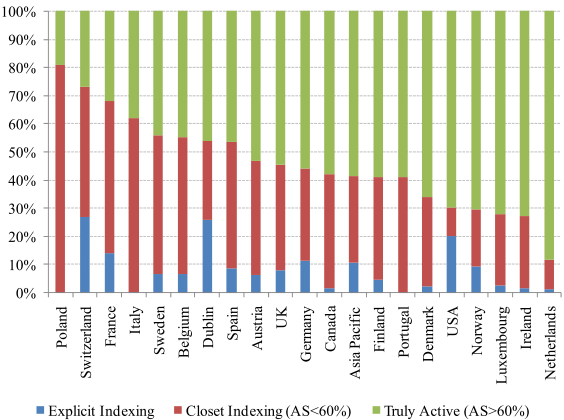
- Closet indexing by funds that are nominally active is common in many countries (see the chart below). About 13% (38%) of actively managed funds in the U.S. (other countries) have an Active Share below 60%. In general, country-level and sector-focused funds tend to have higher degrees of closet indexing than global and regional funds.
- Across countries, levels of explicit and closet indexing reflect level of mutual fund industry competition:
- Greater availability of explicit indexing indicates higher Active Shares and lower fees for active funds.
- More closet indexing indicates higher fees.
- Across active funds, there is a significantly positive relationship between Active Share and fee, stronger in the U.S. A one-standard deviation (22%) increase in Active Share indicates an increase in annual fee of 0.22% (0.15%) for active funds in the U.S. (other countries).
- Over the sample period, active mutual funds beat their benchmarks after fees only 46.7% of the time and exhibit positive four-factor alphas (adjusting for market, size, book-to-market, momentum) only 36.2% of the time. However, odds of a fund beating its benchmark increase with its Active Share. A one-standard deviation increase in Active Share indicates an increase of 0.94% per year in future benchmark-adjusted returns and 0.50% per year in alpha.
- The most actively managed funds in the U.S. and other countries, even though tending to charge the highest fees, tend to beat their benchmarks on a net basis.
- In countries with less competition (less explicit and more closet indexing), it is easier for funds with high Active Shares to beat their benchmarks.
The following chart, taken from the paper, summarizes the levels of explicit and closet mutual fund indexing by country expressed as percentages of total assets under management. The sample includes exchange-traded funds. Closet indexers are nominally active funds with Active Share (AS) measurements below 60%. Results show that explicit indexing is barely available in several countries and the level of closet indexing varies considerably.

In summary, evidence worldwide suggests that mutual fund investors may be able to get the highest returns by focusing on funds which have holdings least like their benchmark indexes.
However, continual ranking of mutual funds according to Active Share is a daunting task.
See “Measuring the Level and Persistence of Active Fund Management” for a related study focused on U.S. equity mutual funds.