Can investors systematically benefit from the perspective that trading is the exchange of one asset for another, not the buying and selling of a single asset? In his paper entitled “Optimal Rotational Strategies Using Combined Technical and Fundamental Analysis”, third-place winner for the 2011 Wagner Award presented by the National Association of Active Investment Managers, Tony Cooper presents methods and tools designed to exploit the precept that valuations are relative. An organizing concept for these methods and tools is the Binary Decision Chart (BDC), which in one form addresses simultaneous analysis of two competing investments for the purpose of switching or weighting and in an extended form addresses combining technical analysis (based on observed price action) and fundamental analysis (indicator-based prediction). BDCs are cumulative return charts, but the horizontal axis may be a technical or fundamental indicator rather than time. More specifically, using various asset price series and indicators, he illustrates the following methods/tools:
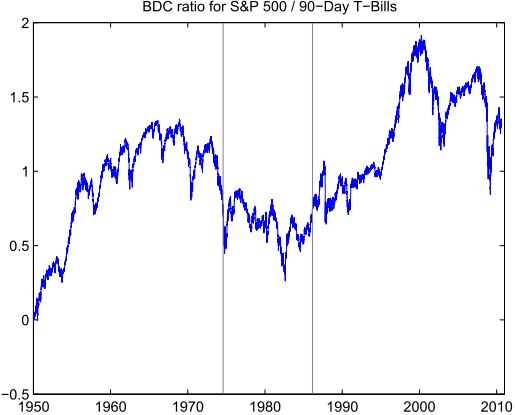
- The BDC ratio examines the ratio of cumulative prices for two competing investments, enabling simultaneous analysis of switching between them via technical analysis or weighting them via risk-return analysis. (See the first chart below.) Compared to a conventional single-asset approach, the BDC ratio:
- Reduces the number of signaled trades, thereby lowering transaction costs, apparently for all assets and trading rules.
- Tends to enhance per-trade returns by improving entry and exit timing, with enhancement apparently greater for trading rules that work better for a single-asset approach.
- The BDC product examines the product of cumulative (expected) prices from a technical indicator and a fundamental indicator, thereby enhancing BDC ratio analysis through incorporation of fundamental analysis. The stronger the predictive power of the fundamental indicator (measured, for example, by the R-squared statistic), the bigger the improvement from BDC product analysis.
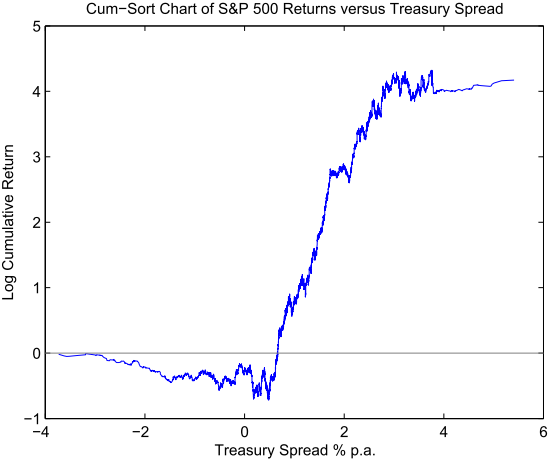
- Conventional cumulative value plotting is over time. Plotting cumulative value against variables rather than time, termed cumsort plotting, helps expose the structure of relationships between predictive indicators and returns. Specifically, cumsort plots expose thresholds and ranges of historical predictor effectiveness. (See the second chart below.) Applying cumsort plotting to BDC ratio analysis and BDC product analysis extends investigation of predictor threshold/range effectiveness to relative valuations.
The following chart, taken from the paper, illustrates BDC ratio analysis as applied to the overall U.S. stock market (represented by the S&P 500 Index) and cash (represented by 90-day Treasury bills) as competing assets. The ratio plotted is the cumulative value of a $1 initial investment in the S&P 500 Index (ignoring dividends) divided by the cumulative value of a $1 initial investment in 90-day Treasury bills (continually rolled) during 1950 through 2010. The vertical gray lines indicate an interval from 1974 to 1986 during which the ratio declines, indicating that cash outperforms capital gain from stocks, even while the stock index appreciates substantially.

The next chart, also from the paper, illustrates the cumsort tool by relating S&P 500 Index behavior to the yield spread between 10-year Treasury notes and 90-day Treasury bills (Treasury Spread). Results suggest three regimes for the relationship: (1) for spreads ranging from most inverted to about 0.5%, the S&P 500 Index varies little; (2) for the range from 0.5% to about 3%, the index appreciates strongly; and, (3) for the range from 3% to its maximum value, the index again varies little. Results suggest that a model for predicting stock market behavior based on the Treasury Spread should use piecewise regressions for these three ranges.

In summary, evidence indicates that, using these methods/tools, investors may be able to (1) enhance asset rotation timing via technical and fundamental analysis of relative asset prices and (2) accelerate investigations of predictive indicators.
Those immersed in analysis of a one asset at a time and in time-scale evolution of prices may find aspects of these methods/tools non-intuitive.