When implemented via exchange-traded funds (ETF), does an equity sector momentum strategy beat an equity style momentum strategy? How do these approaches compare to a geographic equity momentum strategy? In his paper entitled “Optimal Momentum”, runner-up for the 2011 Wagner Award presented by the National Association of Active Investment Managers, Gary Antonacci uses ETFs to compare style, sector and geographic momentum strategies. He uses a six-month ranking period to select the top two of six iShares value-growth-size ETFs, the top three of nine SPDR sector ETFs and the top two of four iShares region/country ETFs each month, with a 0.2% per fund switching friction. In addition, he experiments with adding short-term and intermediate-term Treasury ETFs and then gold to the geographic momentum ranking process. His benchmarks are the Russell 1000 ETF (IWB), the AQR Momentum Index (adjusted by debiting an estimated annual trading friction of 0.7%) and equally weighted portfolios of the ETF groups (rebalanced monthly). Using eight years of monthly ETF prices (2003 through 2010) and 34 years of related monthly index levels, he concludes that:
- Average annual trading frictions vary from 0.39% to 0.53% across momentum strategies.
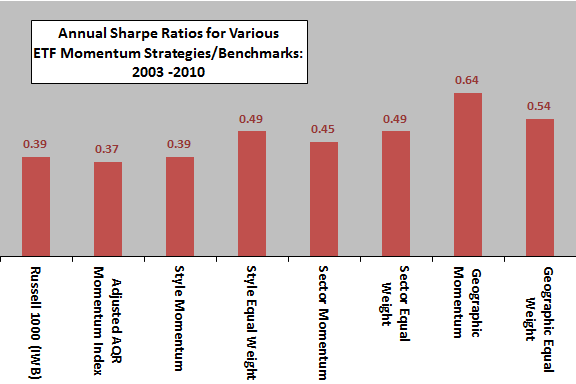
- The geographic momentum strategy generates the highest Sharpe ratio among the basic ETF momentum strategies and benchmarks. The style and sector momentum strategies underperform their equal-weighted counterparts (see the first chart below).
- Adding short-term and intermediate-term Treasury ETFs to the geographic momentum strategy boosts Sharpe ratio from 0.64 to 1.12 and dramatically reduces maximum drawdown.
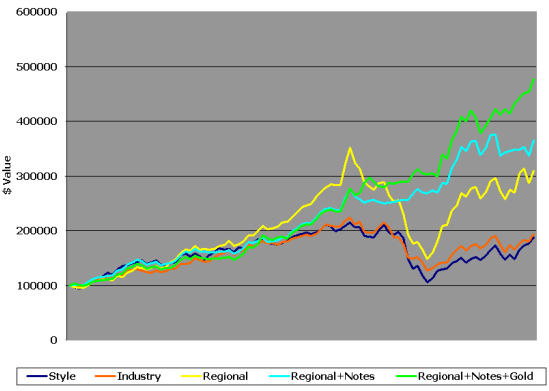
- Further adding gold to the geographic-Treasury ETF momentum strategy boost the Sharpe ratio to 1.31 (see the second chart below).
- A robustness test applied to related indexes with no trading frictions over the period 1977-2010, and subperiods 1977-1993 and 1994-2010, indicates that a geographic-Treasuries-gold momentum strategy substantially outperforms a corresponding equal-weighted strategy in terms of Sharpe ratio.
The following chart, constructed from data in the paper, summarizes annual Sharpe ratios for the various ETF momentum and benchmark strategies as specified over the 2003-2010 sample period. Results suggest that:
- The adjusted AQR Momentum Index does not outperform buying and holding IWB.
- Sector momentum beats style momentum.
- The style and sector momentum strategies offer little or no advantage relative to buying and holding IWB, and both underperform corresponding equal weighting strategies.
- The geographic momentum strategy performs best (but, not shown, experiences the largest maximum drawdown).

The next chart, taken from the paper, translates the Sharpe ratios for the six ETF momentum strategies specified above (with “Industry” meaning sector) into cumulative performance trajectories of $100,000 initial investments over the 2003-2010 sample period. Results show that adding Treasury ETFs and gold to the geographic momentum strategy considerably dampens volatility.

In summary, evidence from a short recent sample suggests that a geographic equity momentum strategy beats equity style and sector momentum strategies, and that adding Treasury ETFs and gold to the geographic momentum mix substantially boosts performance.
Cautions regarding conclusions include:
- As summarized above, the “industry” momentum strategy described in the paper is a sector momentum strategy. Industry segmentation of firms is typically much finer than sector segmentation.
- The basic sample period is very short for reliable inference, consisting of only 16 independent six-month ETF ranking intervals.
- Experimentation with a variety of strategies on the same/overlapping/correlated data introduces data snooping bias, thereby likely overstating the performance of the best strategy. This bias grows with the number of alternatives considered and is especially pernicious for a short sample period.
- Results may include borrowed data snooping bias from selection of a six-month ranking interval. “Simple Sector ETF Momentum Strategy Robustness/Sensitivity Tests” finds that sector ETF momentum strategy performance is inconsistent for different momentum ranking intervals, with a six-month interval perhaps lucky.
- The indexes used in the 34-year robustness test represent idealized (frictionless) market environments. The frictions associated with implementing indexes as portfolios vary considerably over time and across indexes and may be very large over parts of the sample period, undermining confidence that findings for indexes translate to real trading.
- The statistical interpretations assume that asset return distributions are tame (such as the Gaussian or normal distribution). To the extent that actual distributions are wild, these interpretations lose meaning.
Compare results with those presented in “Simple Sector ETF Momentum Strategy Performance” (and associated robustness/refinement testing) and “Doing Momentum with Style (ETFs)”. These analyses involve somewhat longer sample periods and pick one sector/style winner each month. The former finds that adding a long-term simple moving average signal substantially enhances returns. The latter study finds that style momentum outperforms sector momentum.