Eddie Kwong of TradingMarkets.com requested a review of Larry Connors’ Daily Battle Plan (Battle Plan). TradingMarkets.com presents the Battle Plan service as “a reliable guide for short term traders looking to take advantage of the surge in interest in exchange-traded funds (ETFs) with “a record of more than 80% correct trades. …Larry and his research team developed this evidence-based trading to counter the spotty performance and glaring conflicts of interest that exist on Wall Street.” To enable a review, TradingMarkets.com made public a listing of all Battle Plan trades since mid-October 2008, which uses ETF closing prices on trade recommendation dates to calculate gross returns and gross win rate [since removed from public view]. Using the data for the 165 positions listed as of 4/21/11 for the period 10/14/08 through 4/20/11, we find that:
Note that this analysis treats each position in each ETF as a separate trade, whereas the list on TradingMarkets.com aggregates some positions described as (up to three) “units” of a single trade. The separate trade perspective is essential to assessment of portfolio-level performance below.
As a first step in evaluating Battle Plan, we estimate the round-trip trading friction for Battle Plan subscribers as 0.56% of trade value, derived from the following assumptions/data:
- Position size is $10,000.
- Trades occur at the close on recommendation dates as presented at TradingMarkets.com.
- The one-way broker transaction fee is $5 per trade (many may pay a somewhat higher fee).
- The round-tip bid-ask spread is 0.1% of trade value (actual spreads vary by ETF and with market conditions).
- The amortized subscription fee is about $36 per round-trip trade ($195 per month subscription fee as of 4/21/11 divided by an average 5.4 trades per month).
- Ignore costs of shorting and tax implications of trading.
The following table presents some basic performance statistics for the available sample of trades based on these assumptions. Notable points are:
- Over the entire sample, the average trade is profitable at both gross and net levels. However, the average trade is unprofitable at the net level in the second half of the sample.
- Trade profitability is volatile (especially in the first half of the sample), and this volatility may be detrimental to portfolio-level performance.
- Overall win rate at the gross (net) level is 72% (62%). The net win rate for the second half of the sample is 55%.
- Short trades are more profitable, but also more volatile, than long trades.
- For trades grouped as units at TradingMarkets.com, the third unit is more profitable than the second unit, and the second unit is more profitable than the first unit.

Note that including any costs of shorting would lower profitability for all categories except Long Trades. Sensitivity tests on trading frictions indicate that:
- Holding the broker fee at $5 per trade and increasing position size to $100,000 boosts overall average net profit per trade to 0.80% with net win rate 69%. In this case, average net profit per trade in the second half of the sample is 0.15%.
- Increasing the one-way broker fee to $10 per trade and reducing position size to $5,000 results in a overall average net loss per trade of -0.28% with net win rate 48%. In this case, average net loss per trade in the second half of the sample is -0.93% with net win rate 37%.
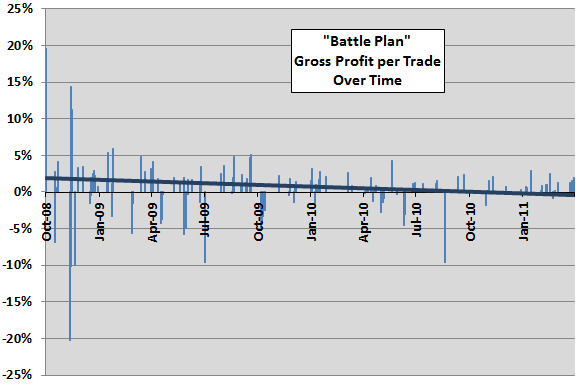
For another perspective on Battle Plan profitability trend, the following chart plots trade-by-trade gross profits over the available sample, along with a best-fit linear trend line. Results indicate a decline in profitability (but also volatility) over time, likely driven by market conditions. A possible interpretation is that the data set commences with market conditions that are favorable to the method of identifying trades.
What about portfolio-level returns?

Generally, portfolio-level analysis is important for capturing the interplay of trade-by-trade returns and return volatility, as well as the effect of allocation to cash while awaiting trade recommendations.
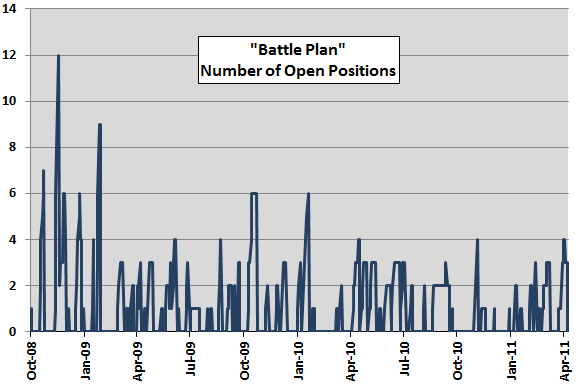
The following chart summarizes the number of open Battle Plan positions over the available sample period based on close-to-close trading, as presented (treating close-to-next close as one trading day). It appears that allocating one-third of capital to each position would catch most recommended trades (in large part because of the three-unit grouped trades), but would miss many trades during the first half of the sample. Assuming a limit of three positions and late entry to open recommendations as cash becomes available, a Battle Plan portfolio is:
- Completely in cash for 55% of trading days.
- One-third invested for 15% of trading days.
- Two-thirds invested for 12% of trading days.
- Fully invested during for 18% of trading days.
Alternatively, a three-position portfolio that ignores all recommendations issued while fully invested can participate in 128 out of the 165 total recommendations. How would a Battle Plan portfolio based on this three-position limit perform?

The final chart summarizes the performance of a hypothetical Battle Plan portfolio with a three-position limit by plotting portfolio values at points when the portfolio is all in cash over the available sample period. Assumptions underlying portfolio performance are:
- Initial capital is $30,000.
- If all in cash, allocate one-third of cash to a new position.
- If one-third invested, allocate half of cash to the next position.
- If two-thirds invested, allocate the cash balance to the next position.
- Skip any recommendations made while fully invested.
- Round trip trading friction is 0.67%, higher than the 0.56% above because the Battle Plan subscription fee amortizes over 128 rather than 165 trades. This assumption becomes increasingly pessimistic (optimistic) as portfolio value rises (falls).
- Return on cash is zero (close to reality for the available sample period).
Under these assumptions, the combination of trading friction and return volatility generally more than offset average gross return per trade. The terminal value of the hypothetical Battle Plan portfolio at the close on 4/20/11 is $25,614. Setting trading friction to zero makes the terminal value $33,978.
Note that, while the return on cash is practically zero over the sample period, the portfolio owner cannot allocate capital elsewhere without the risk of missing new Battle Plan recommendations.
For reference, buying and holding SPDR S&P 500 (SPY) over the sample period provides a total (dividend-reinvested) return of about 40%.

In summary, evidence from several tests of available trade data does not support a belief that all investors can consistently generate good returns by implementing the recommendations of Larry Connors’ Daily Battle Plan.
Cautions regarding findings include:
- Net profitability per trade and net win rate depend on assumptions about trading frictions and trade size, which vary among traders. Moreover, as illustrated in the chart immediately above, trade size would change over time based on portfolio-level performance.
- As illustrated, estimating portfolio-level performance involves many assumptions, and calculations are fairly complex. Different assumptions would generate different outcomes. An investor considering a trade-oriented service should model a personalized portfolio approach to estimate portfolio-level profitability.