Are there reliable ways to exploit differences in asset class returns under Democratic and Republican U.S. presidents? In his April 2011 paper entitled “Is the 60-40 Stock-Bond Pension Fund Rule Wise?”, William Ziemba examines relationships between the U.S. presidential election cycle and long-run returns for several asset classes. Specifically, he investigates the differential performance of large capitalization stocks, small capitalization stocks and bonds when Democrats and Republicans hold the presidency. Using annual asset class return data for 1998 through 2010 to extend prior calculations for 1937-1997 and 1942-1997, he finds that:
- Small capitalization stocks (the bottom fifth) have higher returns during Democratic than Republican administrations, due mostly to the April-December annual interval. Small capitalization stocks significantly beat large capitalization stocks during January under both Democrats and Republicans.
- The performance of large capitalization stocks is unaffected by party in power.
- Returns on bonds and cash are higher during Republican than Democratic administrations.
- Regardless of party in power, both small and large capitalization stocks perform better during the last two years of the presidential term than the first two years.
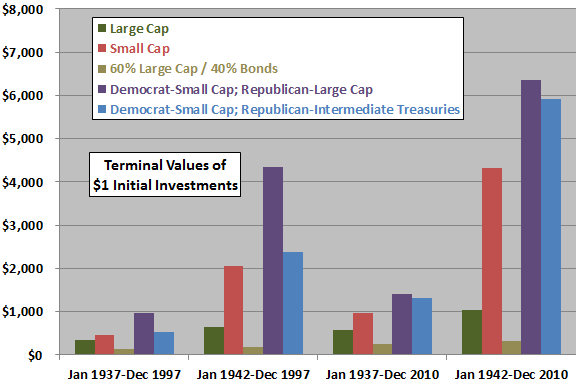
- Two simple investment strategies that hold small capitalization stocks (either large capitalization stocks or intermediate-term Treasuries) when Democrats (Republicans) hold the presidency outperform both buying and holding stocks and a conventional 60/40 stocks/bonds strategy over the entire sample period (see the first chart below). Results do not include trading frictions, but the two party-in-power strategies trade at most every four years.
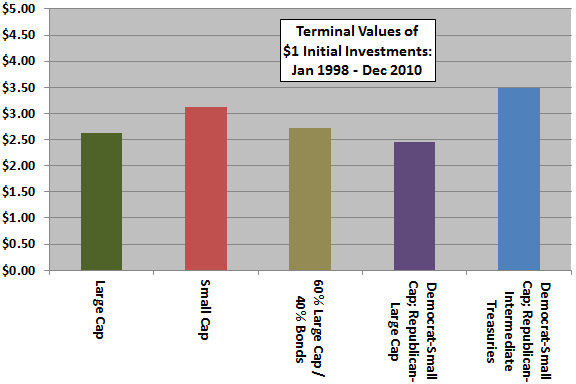
- However, outperformance of these two strategies over a recent subperiod that is arguably out-of-sample with respect to anomaly publication is less convincing (see the second chart below).
The following chart, constructed from data in the paper, summarizes terminal values at the end of December 2010 of $1 investments in five strategies initiated at the beginnings of January 1937 and January 1942 (with no trading frictions and presumably reinvestment of all dividends):
- Buy and hold Large Cap stocks (the S&P 500 Index).
- Buy and hold Small Cap stocks (20% of smallest market capitalizations)
- 60% Large Cap/40% Bonds (bond composition unspecified; rebalancing frequency presumably annual).
- Hold Small (Large) Cap stocks when the President is a Democrat (Republican).
- Hold Small Cap stocks (Intermediate Treasuries) when the President is a Democrat (Republican).
Results indicate that the two party-in-power strategies outperform benchmarks, and also that a relatively short interval (1937-1941) can have a large impact on outcomes.

The second chart, derived from data in the paper, summarizes terminal values for investments initiated at the beginning of January 1998 (arguably out-of-sample with respect to publication of the party-in-power strategies). Results cast some doubt on long-term findings, but the subperiod is short.

In summary, evidence suggests that investors may be able to exploit differences between Democratic and Republican presidencies by holding small capitalization stocks under Democrats and either large capitalization stocks or intermediate-term Treasuries under Republications.
Caution regarding findings include:
- Much of the analysis is in-sample, such that an investor operating in real time could not have known of the anomaly over much of the sample period.
- Given the variability of stock market returns, the sample used is not large in terms of number of presidential terms (17-18). The sample is quite short in terms of potentially confounding multi-term effects such as ebb and flow of inflation (critical to bond returns).
- The study states findings for multiple variables and subperiods, indicating that data snooping bias may be material.
- The study does not describe the statistical significance tests used, but likely assumes a tame distribution of returns.
- While the the two party-in-power strategies trade infrequently, the trading friction for forming and liquidating a portfolio representative of the fifth of stocks with the smallest market capitalizations is likely very high, and perhaps not feasible for modest accounts, over much of the sample period.
- Results from “Party in Power and Stock Returns” suggest that the party controlling the Senate may be more decisive for U.S. stock market returns than the party holding the presidency.