Evidence indicates that 52-week highs may be effective momentum signals for individual stocks, but probably not for major U.S. indexes. What do 52-week highs indicate for emerging markets? In their paper entitled “Predictability of Future Index Returns Based on the 52-Week High Strategy”, Mirela Malin and Graham Bornholt investigate the predictive power of 52-week highs for future returns of emerging markets indexes. To test the power of the 52-week high, they form monthly portfolios that are long (short) the fourth of emerging markets indexes that rank fractionally nearest to (farthest from) their respective 52-week highs and measure returns over the next 1, 3, 6, 9 and 12 months. They also test for comparison similar momentum portfolios with ranking intervals of 3, 6, 9 and 12 months and the same holding intervals. Both strategies insert a skip-month between ranking and portfolio formation. Using monthly dividend-adjusted levels and 52-week highs for 26 emerging markets indexes as available during January 1988 through March 2009 (171 to 255 months per index), they find that:
- The 52-week high strategy is unprofitable for all holding periods. For a 6-month holding period, it generates a monthly gross loss of 0.27%.
- In contrast, a 6-month holding period for the momentum strategy generates a monthly gross profit 0.84%.
- The problem with the 52-week high strategy for emerging markets, unlike developed markets, is that its short positions earn large future returns (annual alpha exceeding 14%). Filtering the short side of the portfolio to exclude indexes with high recent volatility eliminates its abnormally high future returns, but this modified 52-week high strategy is less profitable than a comparable momentum strategy.
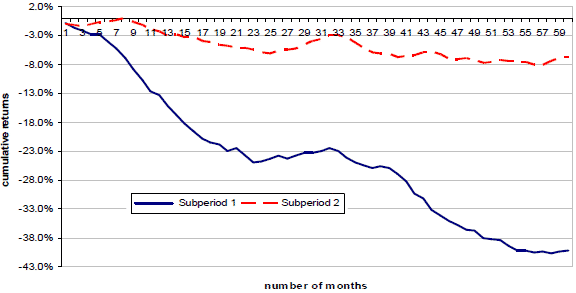
The following chart, taken from the paper, presents the average cumulative gross returns of the 52-week high strategy with 1-month holding period for emerging markets indexes over rolling 60-month intervals for two subperiods: January 1988 through December 1998 (Subperiod 1), and January 1999 – March 2009 (Subperiod 2). Both graphs indicate the strategy is unprofitable, with the difference in performance indicative of modest statistical reliability.

In summary, evidence indicates that 52-week highs do not predict strong future returns for emerging market indexes.
Note that the study is conceptual only in that it:
- Uses indexes rather than tradable index proxies (such as exchange-traded funds), thereby ignoring proxy formation/maintenance fees and frictions.
- Ignores index switching frictions.