Studies of leveraged exchange-traded funds (ETF), such as those summarized in “The Unintended Characteristics of Leveraged and Inverse ETFs” and “The Performance of Leveraged ETFs over Extended Holding Periods”, find that the frequent rebalancing actions necessary to maintain targeted leverage substantially affect long-term performance. A reader observed:
“I’ve read so many articles about how the leveraged ETFs are screwy, and they chew up both sides of the market due to their rebalancing, etc. So I’ve been shorting equal amounts of the long and short double ETFs. I’m short the QID and the QLD, short the TWM and UWM, short the UGL and the GLL, and short the DIG and DUG. I figure, if they are bad longs, they must be good shorts. My thinking is that in a STRONGLY trending market, the position may lose some ground, at least temporarily. But in a weakly trending market, or sideways, both will decay nicely. When I look back on the ones that are a few years old, they just melt away (one side more than the other).”
Does this reverse thinking work? To check, we examine the inception-to-date performance of paired short positions for Ultra S&P500 ProShares (SSO) / UltraShort S&P500 ProShares (SDS) and Ultra QQQ ProShares (QLD) / UltraShort QQQ ProShares (QID). Using daily adjusted closes for these 2X and -2X ETFs for the period 7/13/06 (the first date prices for all four are available) through 10/13/11 (about 63 months), we find that:
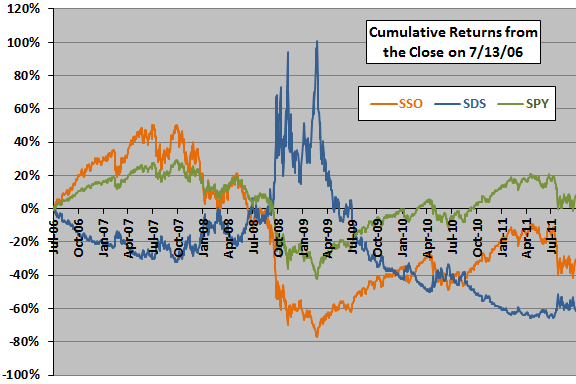
First, we consider the SSO-SDS pair. Over the entire sample period, while the SPDR S&P 500 (SPY) advances by 7.9%, SSO (2X) and SDS (-2X) both undershoot their leverage targets by declining 30.3% and 61.2%, respectively. The following chart compares the evolutions of cumulative returns for SSO, SDS and SPYover the sample period.
How does shorting equal dollar amounts of both ETFs at the outset perform?

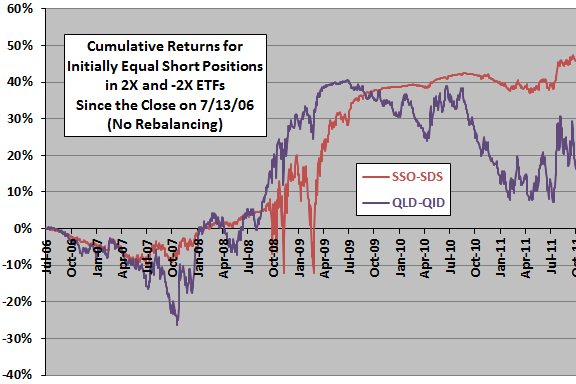
The next chart shows the evolutions of cumulative returns for equal initial short positions in SSO and SDS, and for comparison in QLD and QID, established at the close on 7/13/06 and held through 10/13/11. We assume that: (1) there is no rebalancing of the paired short positions; and, (2) the returns on the initial proceeds from the short sales cancel the costs of maintaining the short positions. The cumulative returns are mostly negative during the initial quarter of the sample period and mostly positive thereafter, with occastional surges/high volatility. The terminal values of initial $20,000 positions on 7/13/06 ($10,000 in each of the 2X and -2X members of both pairs) is $29,145 for SSO-SDS and $23,283 for QLD-QID.
Under what conditions does shorting of a leveraged ETF pair work best? Is volatility of the underlying, as an indicator of level of difficulty in rebalancing the ETFs to targeted leverages, key?

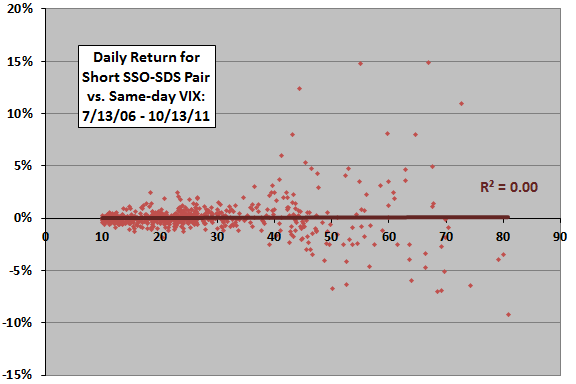
The following scatter plot relates the net daily return for the shorted SSO-SDS pair to same-day S&P 500 Volatility Index (VIX) over the entire sample period. The Pearson correlation for these two series is 0.00, and the R-squared statistic is therefore also 0.00, indicating no relationship.
The comparable scatter of net daily return for the shorted QLD-QID pair versus same-day NASDAQ Volatility Index (VXN) also has an R-squared of 0.00 and is much more dispersed vertically for low values of volatility.
In case there are material non-linearities in the relationships, we try rankings.

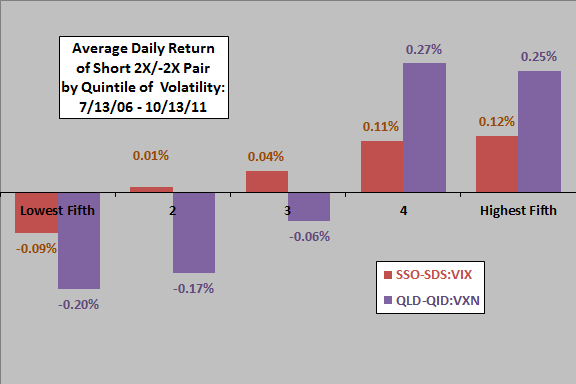
The final chart shows the average net daily return for the shorted SSO-SDS pair by quintile of same-day VIX (SSO-SDS:VIX), and the average net daily return for the shorted QLD-QID pair by quintile of same-day VXN (QLD-QID:VXN), over the entire sample period. Results suggest that the shorted pair tends to produce positive (negative) returns when volatility is relatively high (low).

In summary, shorting pairs of 2X and -2X leveraged ETFs may pay off over long periods as rebalancing effects grind on fund values. Different pairs may behave differently.
Cautions regarding findings include:
- The sample period is not long in terms of number of market regimes relevant to outcomes. Outcomes for this timescale clearly depend on starting point.
- Leverage may amplify return distribution wildness, such that “normal” statistical measures lose meaning.
- As noted, the above analyses do not employ periodic rebalancing of the leveraged pairs. Such rebalancing may materially affect outcomes.
- As noted, the above analyses assume zero net cost of shorting. Any net costs would reduce reported returns.