Simple Asset Class ETF Momentum Strategy (SACEMS)
A systematic approach that ranks asset class ETFs by recent returns and holds the top performers.
Momentum Signal for July 2026 (Preliminary)
Unlock This Month's Signals
Get instant access to current ETF allocations, historical performance data, and monthly signal updates.
How It Works
The Concept
Momentum investing means buying recent winners. Academic research shows that assets with strong recent returns tend to continue outperforming.
The Universe
We track 9 asset class ETFs spanning U.S. and international equities, bonds, real estate, and gold for broad market coverage.
The Signal
Each month we rank ETFs by their past 4-month returns. The top 3 ranked funds are the current "winners" to hold.
Implementation
Update holdings monthly. Equal-weight your portfolio among the top 1, 2, or 3 ETFs based on your risk preference.
Key Details
- Momentum strategies have historically outperformed passive buy-and-hold approaches
- Monthly rebalancing captures trends while keeping turnover manageable
- Holding the top 1 ETF maximizes returns; top 3 ETFs smooths volatility
- The strategy is fully systematic—no forecasting or market timing required
- Simple to implement with just 9 broadly diversified asset class ETFs
Strategy Details
As elaborated in “What Works Best?”, a strategic allocation involving perhaps five to ten equally weighted asset classes available via low-fee exchange-traded funds (ETF) or mutual funds, with periodic rebalancing, is a simple way for individual investors to harvest uncorrelated volatility over the long term. For investors seeking an active (tactical) edge, there is evidence supporting exploitation of intermediate-term relative momentum of asset class proxies.
The Simple Asset Class ETF Momentum Strategy (SACEMS) seeks diversification plus a monthly tactical edge by holding a few top-performing ETFs. We consider three versions of SACEMS, which at the end of each month allocate all funds to the top one (Top 1), the equally weighted top two (EW Top 2) or the equally weighted top three (EW Top 3) asset class ETFs from a diversified set of nine, based on total return over recent months.
Supporting research includes (items may at times be unavailable for a few days during updates and may use an old strategy vintage):
- “SACEMS Optimal Lookback Interval Stability” examines how stable the optimal lookback interval is for the three SACEMS portfolios. “Adjust the SACEMS Lookback Interval?” re-examines the optimal lookback interval for SACEMS based on accumulated historical data, and “Optimal SACEMS Lookback Interval Update” briefly updates.
- “U.S. Federal Taxes and SACEVS, SACEMS” and “Effect of Trading Frictions on SACEMS” explore the effects of federal taxes (in taxable accounts) and trading frictions on SACEMS performance, respectively. “Ranking SACEMS Assets with Unadjusted Returns” excludes dividend/dividend reinvestment effects on momentum ranking.
- “Forcing SACEMS to Agree with SACEVS” tests effects on Simple Asset Class ETF Momentum Strategy (SACEMS) performance of forcing SACEMS to agree with SACEVS when the latter assigns zero weight to stocks or government bonds.
- “SACEMS Optimization in Depth” looks as optimizing the lookback interval for each asset in the SACEMS universe.
- “Adjust the SACEMS Asset Universe?” performs a detailed trade-off between two emerging markets ETFs
- “SACEMS Top 1 Mean Reversion?” presents detailed tests exploring interaction of SACEMS ranks and lookback intervals. “SACEMS Equal-weighted 2-3 Portfolio” tests the performance of the equal-weighted (EW) second and third ranked SACEMS assets. “Different Weighting Schemes for SACEMS Portfolios?” tests use of weighting schemes other than equal-weighted for SACEMS Top 2 and Top 3 portfolios.
- “SACEMS Applied to Mutual Funds” repeats tests in the preceding item on a set of mutual funds that are reasonably similar to the ETF universe used in them, but with a longer history.
- “Alternative Momentum Metrics for SACEMS?” tests some momentum metrics other than simple return over a specified past ranking interval. “Robustness of SACEMS Based on Sharpe Ratio” investigates one of those metrics in depth. “‘Current High’ Boost for SACEMS?” tests adding a filter that restricts monthly asset selections to those currently at an intermediate-term high. “SACEMS with Momentum Breadth Crash Protection” investigates crash protection via momentum breadth (proportion of assets with positive momentum). “SACEMS Based on Martin Ratio?” tests another ranking metric.
- “SACEMS with Risk Parity?” tests an alternative to equal weighting of SACEMS portfolios.
- “Simple Asset Class ETF Momentum Strategy as Diversifier” tests whether the strategy is a good diversifier of the U.S. stock market.
- “SACEMS with Three Copies of Cash” and “SACEMS with SMA Filter” test alternatives requiring that all SACEMS positions have either positive real past returns or are in technical uptrends, respectively.
- “SACEMS with Different Alternatives for ‘Cash'” tests alternative “risk-free” assets as cash substitutes.
- “SACEMS Portfolio-Asset Exclusion Testing” and “SACEMS Portfolio-Asset Addition Testing” explore how specific assets contribute to a relative momentum set. “More International Equity Market Granularity for SACEMS?” looks at a modestly finer breakdown of regional equity markets for the strategy universe. “Combining Sector and Asset Class ETF Momentum” adds nine sectors to the mix of asset choices. “Substituting IYH for SPY in SACEMS”, “Substitute VIG for SPY in SACEVS and SACEMS?”, “GDX Instead of GLD in SACEMS?”, “Substitute QQQ for SPY in SACEVS and SACEMS?” and “Conditionally Substitute SSO for SPY in SACEVS and SACEMS?” test a single specific asset substitution in SACEMS. “Horse Race: SSO or QQQ vice SPY in SACEVS and SACEMS?” compares thematic and leveraged stocks. “Adding VUG and VTV to SACEMS” explores capture of value and growth streakiness. “SACEMS with Bitcoin?” tests adding a bitcoin ETF to the SACEMS universe.
- “SACEVS and SACEMS from a European Perspective” investigates the effects of the U.S. dollar-euro exchange rate on strategy performances, addressing the perspective of a European investor.
- “Effects of Execution Delay on SACEMS” looks at effects of delaying action on changes in winner portfolios for up to 21 trading days.
- “SACEMS with Inverse VIX-based Lookback Intervals”, “Slow Down or Speed Up SACEMS with Volatility?” and “Asset Class Momentum Faster During Bear Markets?” focus on performance of SACEMS under different equity market conditions.
- “Add Position Stop-loss to SACEMS?” tests whether adding an intra-month stop-loss rule to the strategy improves performance by avoiding downside volatility within the strategy.
- “Add Position Stop-gain to SACEMS?” tests whether adding an intra-month stop-gain rule to the strategy improves performance by harvesting upside volatility within the strategy.
- “SACEMS at Weekly and Biweekly Frequencies” examines whether weekly or biweekly rotation signals outperform monthly signals. “SACEMS at a Bimonthly Frequency” does the same for bimonthly rotation.
- “Optimal Monthly Cycle for SACEMS?” investigates whether using a monthly cycle other than end-of-month to determine winning assets improves strategy performance.
- “Simple Asset Class ETF Maximum Momentum Strategy” tests an alternative approach that that measures ETF returns from the lowest daily close within the momentum measurement interval rather than the monthly close at the beginning of the momentum measurement interval.
- “Simple Asset Class Leveraged ETF Momentum Strategy” and “Using One Third 3X Funds for Some SACEMS Assets” investigate whether using leveraged versions of asset class proxies improves strategy performance. “SACEMS with Margin” and “SACEVS-SACEMS Leverage Sensitivity Tests” alternatively explore use of margin rebalanced monthly to boost SACEMS performance.
- “Sticky SACEMS” tests whether limiting the trading of the strategy by holding winners until they drop out of the top one, two or three is effective. “Limited Rebalancing for SACEMS?” tests whether suppressing trading frictions by ignoring precise rebalancing to equal weights while an asset remains in the portfolio carries a penalty.
- “Buffered Winner Asset Class ETF Momentum Strategy” tests whether limiting the trading of the strategy by continuing to hold a past winner until it loses to a new winner by a significant margin is effective.
- “Limited-choice Asset Class Momentum Strategy” tests whether limiting choices of assets to equity-like (other) asset classes during U.S. bull (bear) markets is effective.
- “SACEVS and SACEMS Performance by Calendar Month” quantifies average strategy performance by calendar month.
- “SACEMS vs. Luck” examines how the strategy stacks up against pure luck.
- “SACEMS and SACEVS Changes for Coordination and Liquidity” documents minor April 2017 adjustments that trade purity of logic for practicality.
- “SACEMS Data Changes – January 2018” documents changes in past source data.
- “SACEMS Data Changes – May 2014” documents changes in past source data.
- “Model Momentum Strategy Adjustment” documents a September 2012 change in specifications for the tracked strategy.
We started tracking SACEMS in 2010, with a few adjustments since as documented in the above list. Adjustments include changing both the lookback interval and the ETFs in the base list. The most recent change is mid-2019.
Some investors may want to follow one of the alternatives tracked here. Others may want to adapt them with modifications suited to their individual goals and constraints. Still others may want to apply the analysis approaches to test other strategies. Something to keep in mind is that adding complexity to a strategy increases the number of ways to optimize it in backtests and thereby elevates potential for data snooping bias.
The next section summarizes historical (backtest) performance data.
Historical Performance
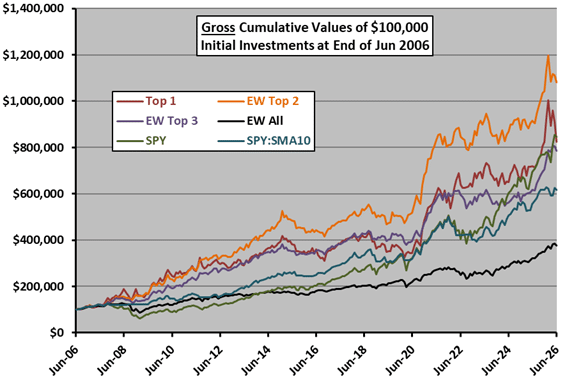
The following chart shows the gross cumulative values of $100,000 initial investments in SACEMS Top 1, EW Top 2 and EW Top 3 since the end of June 2006 (based on availability of ETF data). The chart includes three benchmarks: (1) an equally weighted, monthly rebalanced portfolio of all ETFs in the SACEMS universe (EW All), indicative of simple diversification; (2) buying and holding SPDR S&P 500 (SPY); and, (3) SPY:SMA10, a simple timing strategy that holds SPY (Cash) when the S&P 500 Index is above (below) its 10-month simple moving average.
Results indicate that SACEMS is attractive, but has setbacks.
For perspective, we look at an array of performance metrics.
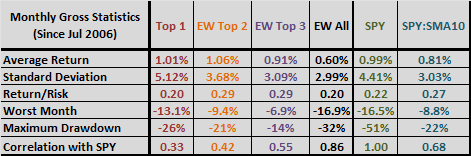
The following table summarizes some monthly statistics for these same strategies over the available sample period. Return/Risk is average return divided by standard deviation. Maximum (peak-to-trough) drawdowns are based on monthly measurements over the sample period.
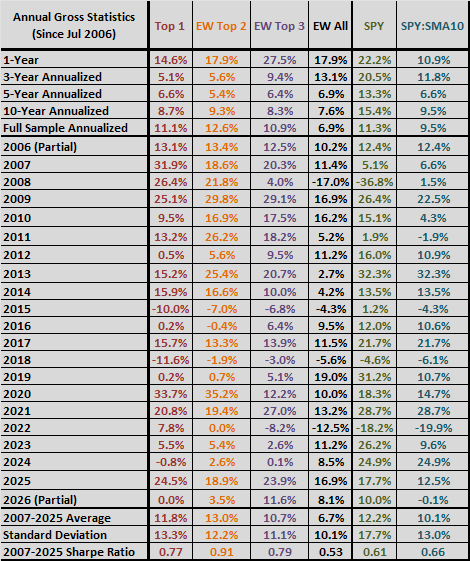
The next table summarizes annual/annualized returns for these strategies over different intervals commonly used to describe performance of funds. The annualized returns are compound annual growth rates (CAGR). For Sharpe ratio, to calculate excess annual return, we use average monthly yield on 3-month Treasury bills during a year as the risk-free rate for that year.
The next section offers a discussion of this performance.
Momentum Signal for July 2026 (Preliminary)
Performance Assessment
The charts and data below show how the momentum strategy has performed over time compared to a passive SPY benchmark. Results are based on backtested data and actual signals since inception.
Subscriber Content
Subscribe to view detailed performance data, charts, and historical returns.
Get Full AccessBacktest It Yourself
Use the Growth Simulator to compare strategy variants over any time period, or blend momentum with value to find your ideal mix.
Open Strategy Tools