Does aggregate social network sentiment, as measured by Facebook’s Gross National Happiness (GNH), predict future stock market returns? In his August 2011 preliminary draft paper entitled “Can Facebook Predict Stock Market Activity?”, Yigitcan Karabulut investigates the relationship between GNH as a proxy for investor sentiment and stock market activity. Per Facebook, GNH derives from “…millions of people [sharing] how they feel with the people who matter the most in their lives through status updates on Facebook. …Grouped together, these updates are indicative of how we are collectively feeling. …When people in their status updates use more positive words–or fewer negative words–then that day as a whole is counted as happier than usual.” The author corrects daily stock returns for temperature, precipitation and hours of darkness in New York and for the lunar cycle. Using daily GNH measurements for U.S. Facebook members, stock market returns and weather/seasonal/lunar phase data over the period 9/8/07 to 3/1/11 (876 trading days), he finds that:
- The mean (median) GNH over the sample period is -0.017 (-0.015), and the mean daily broad stock market return is -0.004%. The lowest value for GNH occurs on 9/16/08 during a tumultuous stock market.
- A one-standard deviation increase in GNH predicts a statistically and economically significant average increase in next-day gross stock market return of 0.12%.
- The effect is somewhat stronger for sentiment-sensitive stocks. A one-standard deviation increase in GNH predicts an average increase in next-day gross small/growth stock return of 0.15%.
In summary, evidence suggests that daily change in Facebook Gross National Happiness for the U.S. may have some power to predict next-day U.S. stock market return.
Cautions regarding findings include:
- Facebook users reporting daily feelings may not be representative of investor sentiment.
- Facebook publishes daily GNH with an apparent delay of two to three calendar days, rendering any finding regarding next-day stock market return unexploitable.
- Return calculations are apparently gross, not net. Reasonable trading frictions are material compared to reported abnormal returns.
- Analyses are in-sample. An investor operating in real time may have drawn different conclusions based on strictly historical data.
- The sample is very small in terms of seasonal effects (3.5 years).
- Statistical significance tests assume tame variable distributions. To the extent that distributions are wild (generally pronounced at high sampling frequency), these tests break down.
For a independent, simplified perspective on findings, we test the relationship between changes in GNH and S&P 500 SPDR (SPY) returns for available data. To account for delayed release of GNH, we relate weekly (Friday to Friday) change in GNH to a weekly future SPY return (Monday close to Monday close). These intervals assume that GNH measurements for Fridays are available by the stock market close on the following Monday. Using GNH Friday readings and dividend-adjusted SPY Monday closes during 9/10/07 through 8/29/11, we find that:
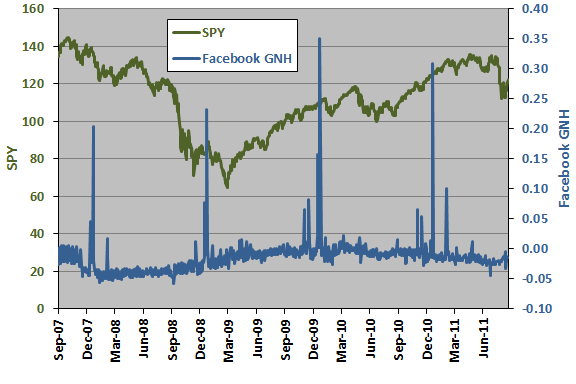
The following chart shows daily values of SPY and Facebook GNH over the available sample period. Visual inspection indicates no obvious systematic relationship between the two series. The four regular large spikes in GNH fall on New Year’s Eves (December 31).
For precision, we relate SPY returns to changes in GNH.

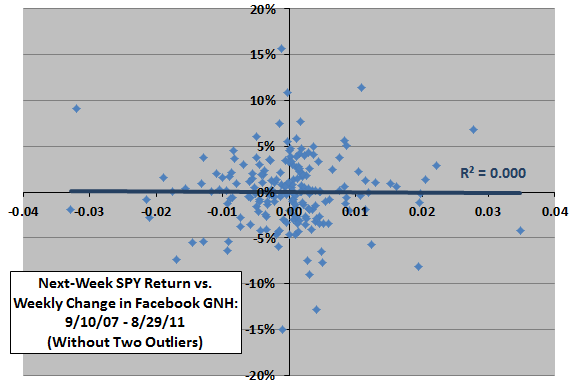
The following scatter plot relates next-week (Monday to Monday, as specified above) SPY returns to weekly (Friday to Friday) changes in GNH over the available sample period, excluding two outlier observations generated by a week that ends on one of the spikes above (12/31/10). The Pearson correlation for the relationship is -0.01 and the R-squared statistic 0.000, indicating no ability of changes in GNH to predict future SPY returns.
Including the two outliers changes the Pearson correlation to -0.03 and the R-squared statistic to 0.001.
Might there be some other lead-lag relationship?

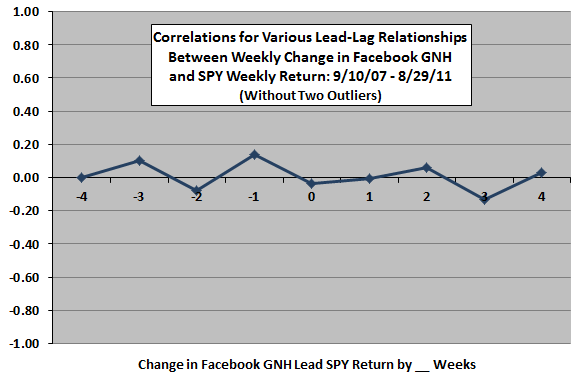
The next chart summarizes various lead-lag relationships between weekly SPY returns and weekly changes in GNH over the available sample period (excluding the two outlier observations), ranging from SPY returns lead changes in GNH by four weeks (-4) to changes in GNH lead SPY returns by four weeks (4). The strongest, though still modest, indication is that the stock market leads GNH by a week.
Including the two outliers flattens the bumps.
In case there is a material non-linear effect, we consider SPY returns by range of changes in GNH.
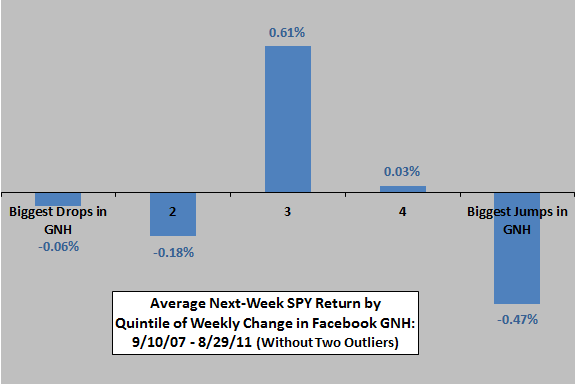
 The final chart summarizes average next-week SPY return by quintile of weekly change in GNH over the available sample period, excluding the two outlier observations. The average SPY return for all weeks in the sample is 0.01%, with standard deviation 3.79%. Variation across quintiles is not systematic. If anything, jumps in GNH indicate a tendency for poor stock market returns the next week.
Including the two outliers does not affect conclusions.

In summary, evidence from simple tests on available data indicates little or no power for changes in Facebook Gross National Happiness for the U.S. to predict U.S. stock market returns.
Cautions regarding these independent findings include:
- Again, results are gross, not net. Reasonable trading frictions from strategies seeking to exploit findings would affect reported returns.
- Analyses are in-sample. An investor operating in real time may have drawn different conclusions based on strictly historical data.