Financial market commentators and media sometimes cite the Economic Cycle Research Institute’s (ECRI) U.S. Weekly Leading Index (WLI) as an important economic indicator, implying that it is predictive of future stock market performance. According to ECRI, WLI “has a moderate lead over cyclical turns in U.S. economic activity.” ECRI publicly releases a preliminary (revised) WLI value with a one-week (two-week) lag. Does this indicator usefully predict U.S. stock market returns? Using WLI values for January 1967 through January 2016 and contemporaneous weekly levels of the S&P 500 Index, we find that:
Analyses exclude calculations associated with 9/14/01, for which there is no S&P 500 Index weekly close.
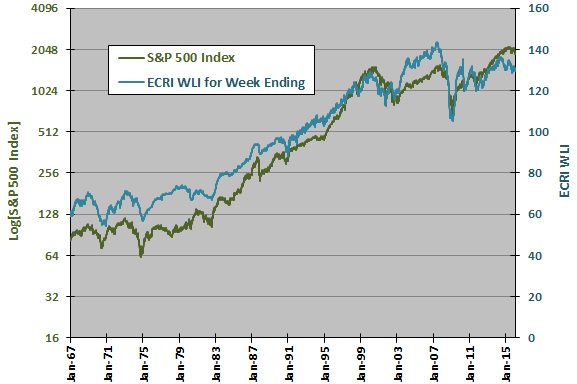
The following chart compares the behaviors of the S&P 500 Index (on a logarithmic scale) and WLI over the entire sample period. The shapes appear similar, but whether one series leads or lags the other is not obvious.
For precision, we relate future weekly stock market return to weekly change in WLI.
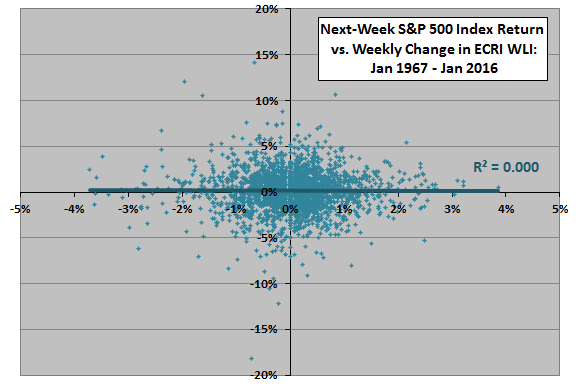
The following scatter plot relates next-week (week after WLI initial release) S&P 500 Index return to weekly percentage change in WLI over the entire sample period. The Pearson correlation for the two series is 0.00 and the R-squared statistic is 0.000, indicating that weekly changes in WLI explain nothing about U.S. stock market returns the week after WLI initial release.
Might changes in WLI predict stock market returns at some horizon longer than one week?
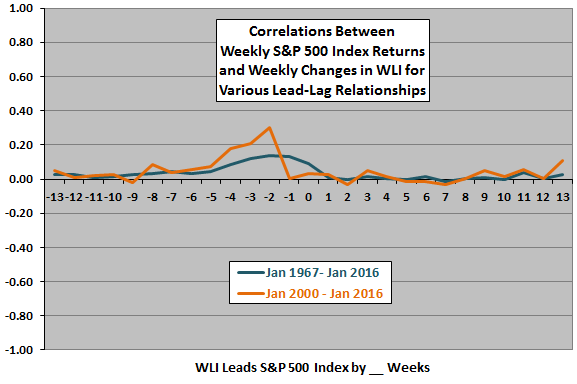
The next chart summarizes correlations between weekly S&P 500 Index return and weekly change in WLI for various lead-lag relationships, ranging from stock market return leads WLI change by 13 weeks (-13) to WLI change leads stock market return by 13 weeks (13), both for the entire sample period and the subperiod since the beginning of 2000. Week o is the WLI measurement interval. Weak 1 is the week after initial WLI release and corresponds to the scatter plot above. Results suggest that:
- Stock market returns from one to about eight weeks ago positively lead changes in WLI.
- There is no evidence that changes in WLI meaningfully lead stock market returns at horizons up to 13 weeks.
In other words, a recent advance (decline) in the stock market has some power to predict an increase (decrease) in WLI, but changes in WLI have no power to predict stock market returns.
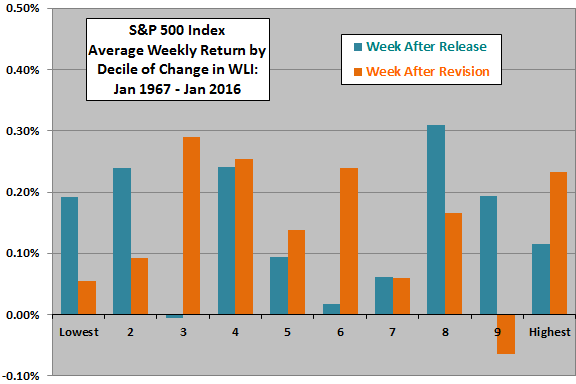
In case there is a material non-linearity in the relationship, we examine future stock market returns by ranked tenth (decile) of weekly changes in WLI.
The final charts summarize average weekly S&P 500 Index returns by decile of weekly changes in WLI during the week after preliminary public release and during the week after final public release, both for the entire sample period (upper chart) and for the subperiod since the beginning of 2000 (lower chart). There are 255-256 and 83-84 observations per decile, respectively. Results are clearly unsystematic across deciles in all cases, and different between the overall sample period and a recent subperiod.
Evidence does not support a belief that WLI usefully predicts stock market returns at its release frequency.
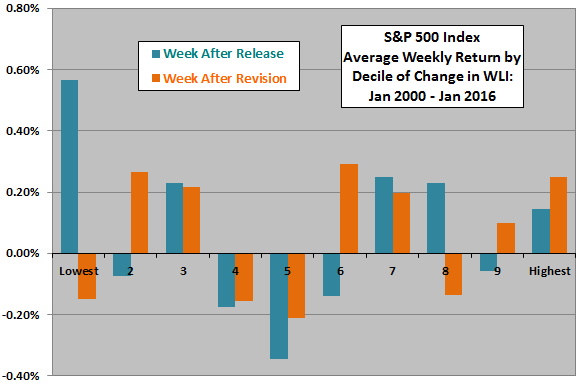
In summary, evidence from simple tests indicates that ECRI WLI movements lag stock market behavior, offering no weekly stock market trading intelligence.
Cautions regarding findings include:
- The above analyses are in-sample, not real-time experience. Since results indicate no predictive power, we attempt no out-of-sample calculations.
- ECRI may have constructed much of the WLI history retrospectively. To the extent that the construction methodology optimizes the WLI formula and parameter settings for historical performance, this history incorporates data snooping bias (luck) that overstates reasonable expectations for out-of-sample forecasting performance.
- ECRI apparently recalibrates WLI, such that the “historical” sample differs from values released in the past (above and beyond prior-week revisions), and thereby incorporates look-ahead bias. A comparison of “historical” samples taken in June 2013 and September 2014 indicates differences in WLI levels and weekly changes extending as far back as 1993. In other words, a current “historical” sample differs from as-released data. Using as-released versus recalibrated data is a trade-off between measurement of real-time experience and presentation of the best forward-looking model. Using weekly percentage changes in WLI mitigates concern about revisions.