In an August 2004 article entitled “Time is Right for These 7 Biotechs” (apparently no longer available on MSN Money), Jim Jubak states: “…in most years, biotechs decline in the spring as investors anticipate a summer hiatus in the conferences where new clinical results are announced. They rally in the fall as the conference schedule and the volume of news increases.” Does empirical data support belief in these observations? To check, we examine the behavior of the AMEX Biotechnology Index (BTK) across the calendar year. Using monthly closing levels for BTK from its inception in January 1995 through August 2012 (over 17 years), and contemporaneous monthly returns for the S&P 500 Index for detrending, we find that:
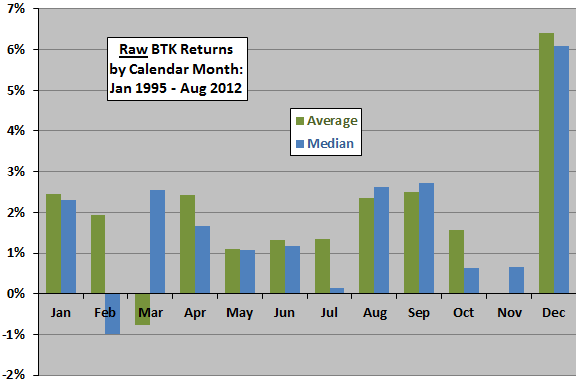
The following chart shows the raw average and median returns by calendar month for BTK over the sample period. The average monthly return for BTK for all months in the sample is 1.9%, with standard deviation 10.4%. A large difference between the average and median indicates that one or a few very extreme months drive the average. For example, 11 of 17 Februaries in the sample have negative returns, but an extremely large positive return in February 2000 makes the average return positive. Based on raw returns:
- December stands out as exceptionally strong.
- January, April, August and September are above average.
- Other months are relatively weak and/or volatile.
Is biotech seasonality distinct from that of the overall stock market?

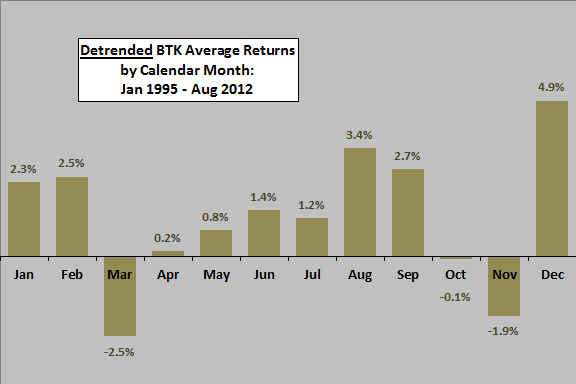
The next chart shows the detrended average return by calendar month for BTK over the sample period, with detrending accomplished by subtracting the return for the S&P 500 Index from the return for BTK each month. The average abnormal monthly return for BTK for all months in the sample is about 1.2%. Based on detrended returns:
- December still stands out as exceptionally strong.
- Biotechs tend to outperform during January, February, August and September.
- Biotechs tend to underperform during March and November.
Do biotechs reliably lead or lag the broad U.S. stock market?

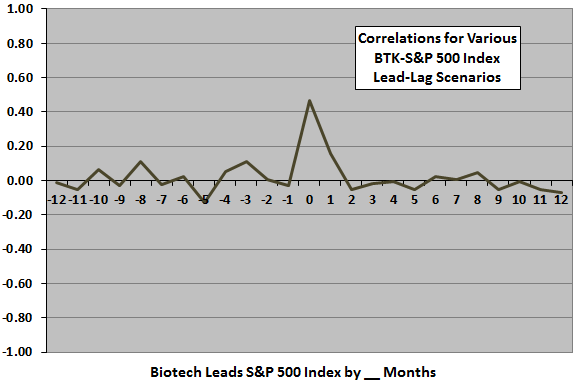
The final chart summarizes Pearson correlations between monthly S&P 500 Index returns and BTK monthly returns for various lead-lag scenarios, ranging from the S&P 500 Index leads BTK by 12 months (-12) to BTK leads the S&P 500 Index by 12 months (12). The peak at “0” is the coincident relationship. Results suggest there may be a weak tendency for biotechs to lead the overall stock market by a month.

In summary, evidence from a modest available sample suggests that biotech stocks tend to be strong in late summer and December.
One caution regarding findings is that sample size is very small for a calendar month analysis, such that one or two additional observations could materially alter conclusions.