The employment-population ratio (percentage of those age 16 or older who are employed) is arguably a better measure of the U.S.employment situation than either employment or the unemployment rate. Is this series usefully predictive of U.S. stock market behavior in subsequent months, quarters and years? Using monthly seasonally adjusted employment-population ratio data from the Bureau of Labor Statistics and contemporaneous S&P 500 Index data for the period January 1950 through June 2012 (750 months), we find that:
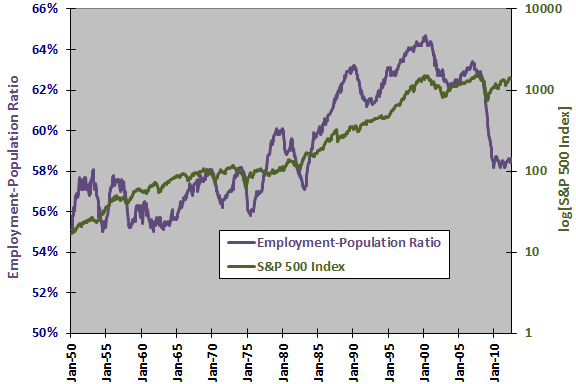
The following chart compares the behavior of the seasonally adjusted employment-population ratio and the S&P 500 Index (on a logarithmic scale) over the entire sample period. Visual inspection suggests a recent positive relationship between the two series, but the relationship appears to be inconsistent over the long run with no obvious lead-lag.
For a closer look, we compare the monthly changes in employment-population ratio to monthly future stock market returns.
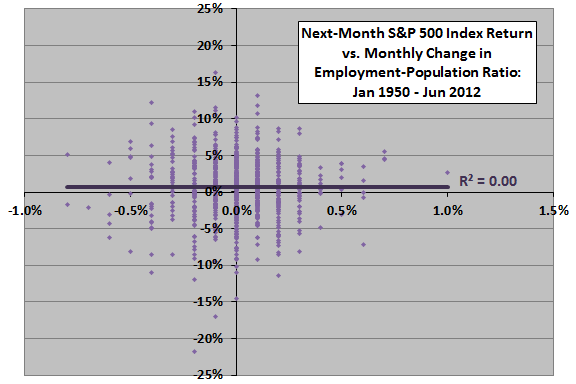
The following scatter plot relates next-month S&P 500 Index return to monthly change in the employment-population ratio (released near the beginning of the next month) over the entire sample period. The Pearson correlation for the two series is -0.02 and the R-squared statistic 0.00, indicating no relationship between the two series.
Over the subperiod since 1990, the Pearson correlation for the two series is 0.09 and the R-squared statistic 0.01, indicating that monthly variation in employment growth explains about 1% of the variation in next-month stock market return.
Results do not encourage belief in a useful relationship.
In case there is a material non-linearity, we calculate average future stock market returns by range of employment growth.
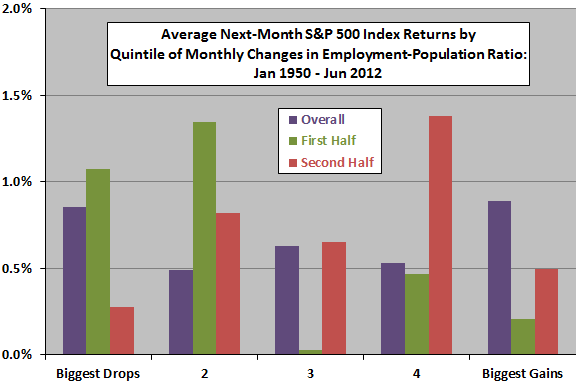
The next chart summarizes average next-month S&P 500 Index returns by quintile of monthly change in the employment-population ratio over the entire sample period and two equal subperiods. There are 149 (75) observations per quintile for the entire sample period (subperiods). The non-systematic variations across quintiles and inconsistencies across subperiods undermine belief in any useful relationship between change in employment-population ratio and future stock market behavior at a one-month horizon.
Might the relationship between employment growth and stock market return be stronger over some longer measurement/forecast interval?
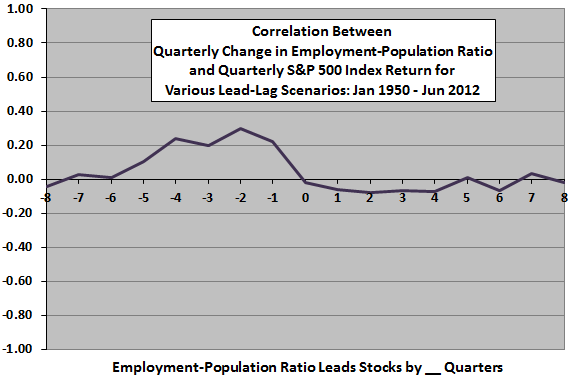
The next chart plots Pearson correlations for various lead-lag relationships between quarterly change in the employment-population ratio and quarterly S&P 500 Index return over the entire sample period, ranging from stock market returns lead changes in the employment-population ratio by 12 months (-12) to changes in the employment-population ratio lead stock market returns by 12 months (12). Results suggest that:
- A relatively strong (weak) stock market indicates an increase (decrease) in the employment-population ratio over the next year or so.
- In contrast, an increase (decrease) in the employment-population ratio gives slight contrarian indication of a relatively weak (strong) stock market over the next year.
For indications of the strength of the latter contrarian indication, we look at quarterly and annual scatter plots.
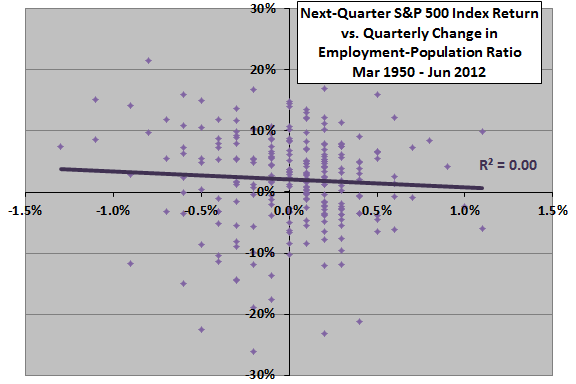
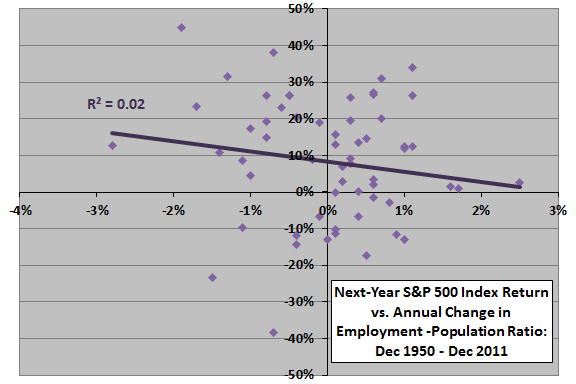
The next two scatter plots relate next-quarter (upper chart) and next-year (lower chart) S&P 500 Index return to quarterly and annual change in employment-population ratio over the entire sample period.
At quarterly intervals, the Pearson correlation for the two series is -0.06 and the R-squared statistic 0.00, indicating that quarterly variation in the employment-population ratio explains less than 0.5% of the (inverse) variation in next-quarter stock market return.
At annual intervals, the Pearson correlation for the two series is -0.15 and the R-squared statistic 0.02, indicating that annual variation in the employment-population ratio explains about 2% of the (again inverse) variation in next-year stock return.
In other words, there is a slight indication that an increase (decrease) in the employment-population ratio forecasts a relatively weak (strong) stock market at a one-year horizon.
In summary, evidence from simple tests offers no support for a belief that monthly changes in the U.S. employment-population ratio usefully predict next-month U.S. stock market returns. For an annual horizons, there is slight indication of an inverse relationship.
Cautions regarding findings include:
- The sample is not very long in terms of number of economic cycles.
- Analyses are in-sample. An investor operating in real time would not have access to data for the entire sample period.
- Since employment data releases occur after the end of the month by a few days, there is some offset between changes in employment-population ratio and stock market returns as calculated above. This offset could affect the statistics.
- Employment-population ratio data used above is as-revised rather than as-released. The effect of revisions (such as changes in seasonal adjustments) on statistics could be material.
This analysis does not rule out the possibility that surprises in changes in the employment-population ratio, relative to some measurable expectation, usefully forecast intermediate-term stock market returns.